Dynamic Betweenness Centrality
Description
Betweenness centrality is among the most common metrics in graph analytics owing to its utility in identifying critical vertices of graphs. It is one of the tools in centrality analysis, a set of techniques for measuring the importance of nodes in networks.
The notion of Betweenness centrality is based on shortest paths: the shortest path between two nodes is the one consisting of the fewest edges, or in case of weighted graphs, the one with the smallest total edge weight. A node’s betweenness centrality is defined as the share of all shortest paths in the graph that run through it.
MAGE includes a fully dynamic betweenness centrality computation tool that implements the iCentral 1 algorithm. iCentral saves up on computation in two ways: it singles out the nodes whose centrality scores could have changed and then incrementally updates the scores, making use of previously calculated data structures where applicable.
Dynamic algorithms such as iCentral are especially suited for graph streaming solutions such as Memgraph. As updates arrive in a stream, the algorithm avoids redundant work by processing only the portion of the graph affected by the update.

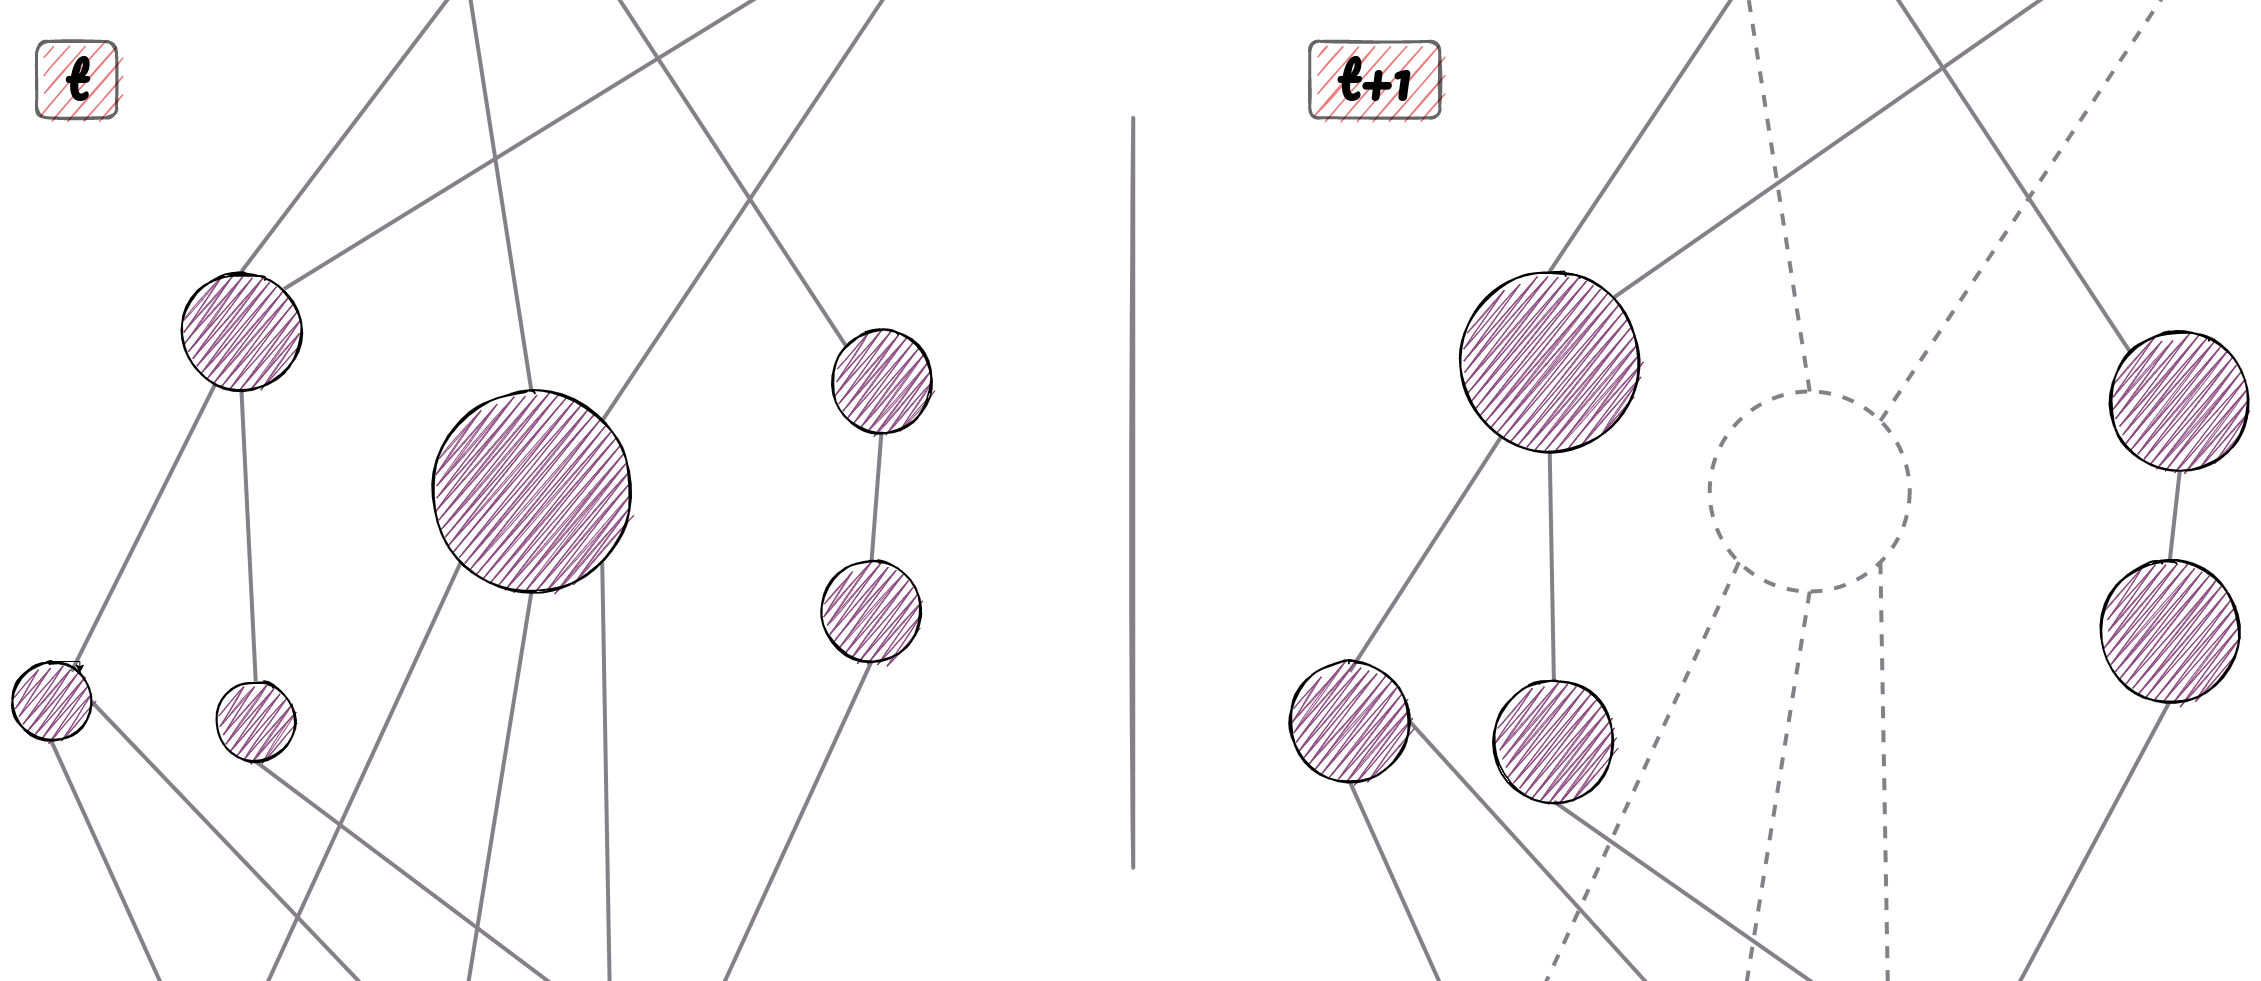
After the node in the center is erased, shortest paths run through other nodes and their betweenness centrality scores increase. A larger node size signifies a higher betweenness centrality score.
Materials
Implementation
Dynamic Betweenness Centrality is implemented as part of the MAGE project. Be sure to check it out at the link above. ☝️
Use cases
Real-world networks are often dynamic and evolve rapidly. Consequently, re-running static algorithms after each update often proves infeasible. Dynamic algorithms avoid redundant work by processing only the portion of the network affected by the latest update.
Social networks are a quintessential example of rapidly evolving graphs – people step in and out of contact every day, and even a single change can significantly alter the network of relationships. Furthermore, individual users’ activities often come in bursts of many interactions in short order. With real-time network-aware applications (e.g. finding influential persons, trend analysis), being able to instantly reflect graph changes into centrality values is crucial.
Another key use case of this algorithm is logistics/transportation. In complex transportation networks, measuring betweenness centrality helps identify bottlenecks and chokepoints, as well as monitor how traffic is redistributed as nodes or connections between them become open or close. This can help with applications such as shipping/delivery routes or urban traffic grid optimization on both cost and benefit fronts.


