Memgraph Lab user manual
Memgraph Lab is a visual user interface that enables you to import and export data to and from Memgraph database, write and execute Cypher queries, visualize graph data, view and optimize query performance, develop query modules in Python or connect to data streams.
Here is a short overview of the Lab's interface, features it provides, and links to resources that will help you achieve your graph goals. At the end of the page, there is a Lab demo video from the Memgraph Cloud launch if you need more visual input.
Overview
Every time you open Memgraph Lab, it will greet you with an Overview, offering resources and actions depending whether your database is empty or not, and whether you ran any queries or not.
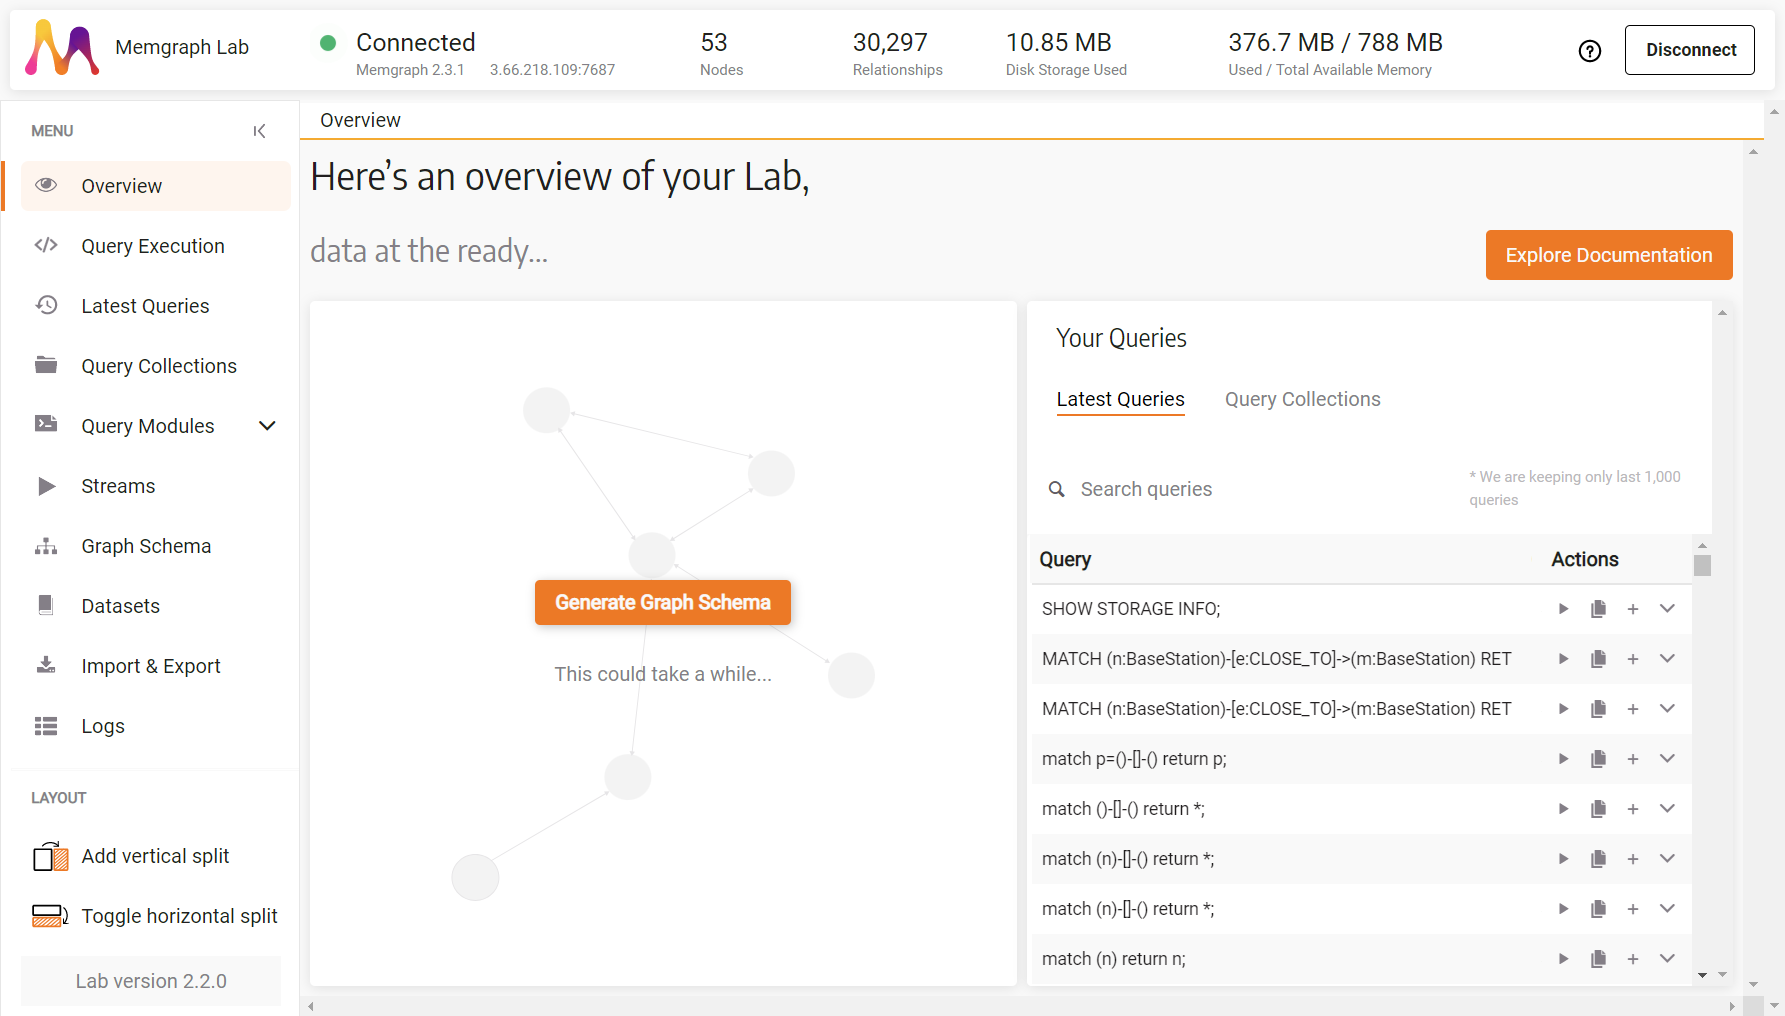
At the top of the screen, you will find information about:
- Connection status
- Memgraph version, IP address, and port of the database
- Number of nodes and relationships currently in the database
- Disk storage used, and total and available RAM
In the top right corner, you can find the help button that will provide you with helpful documentation and links to the Memgraph community.
All the Memgraph Lab sections are listed in the left side menu, below which you can find the Layout options and Memgraph Lab version.
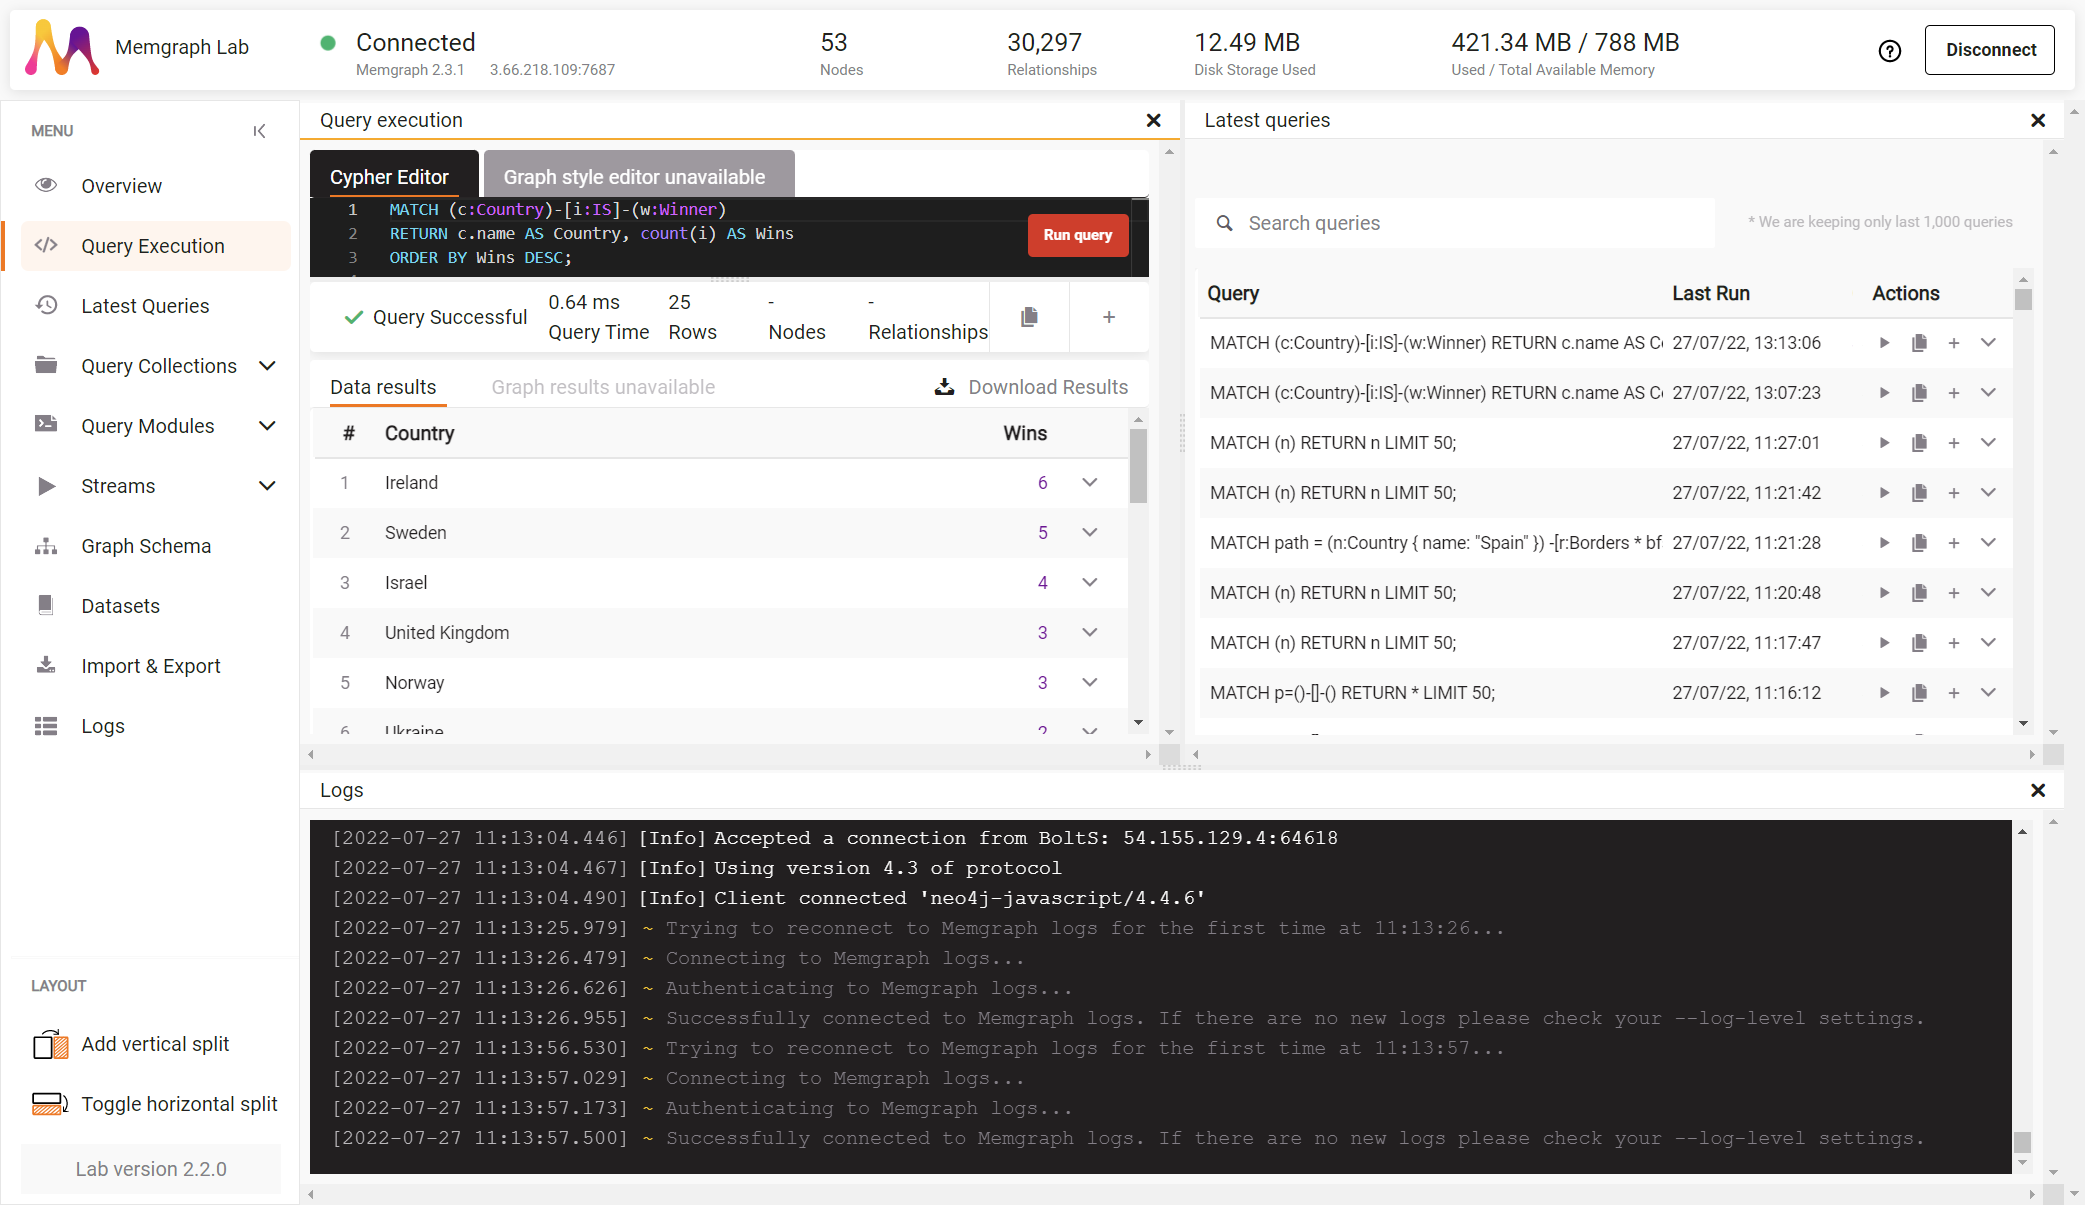
Query Execution
In this section, you can write and run queries, as well as see their tabular or graphical results.
Cypher Editor
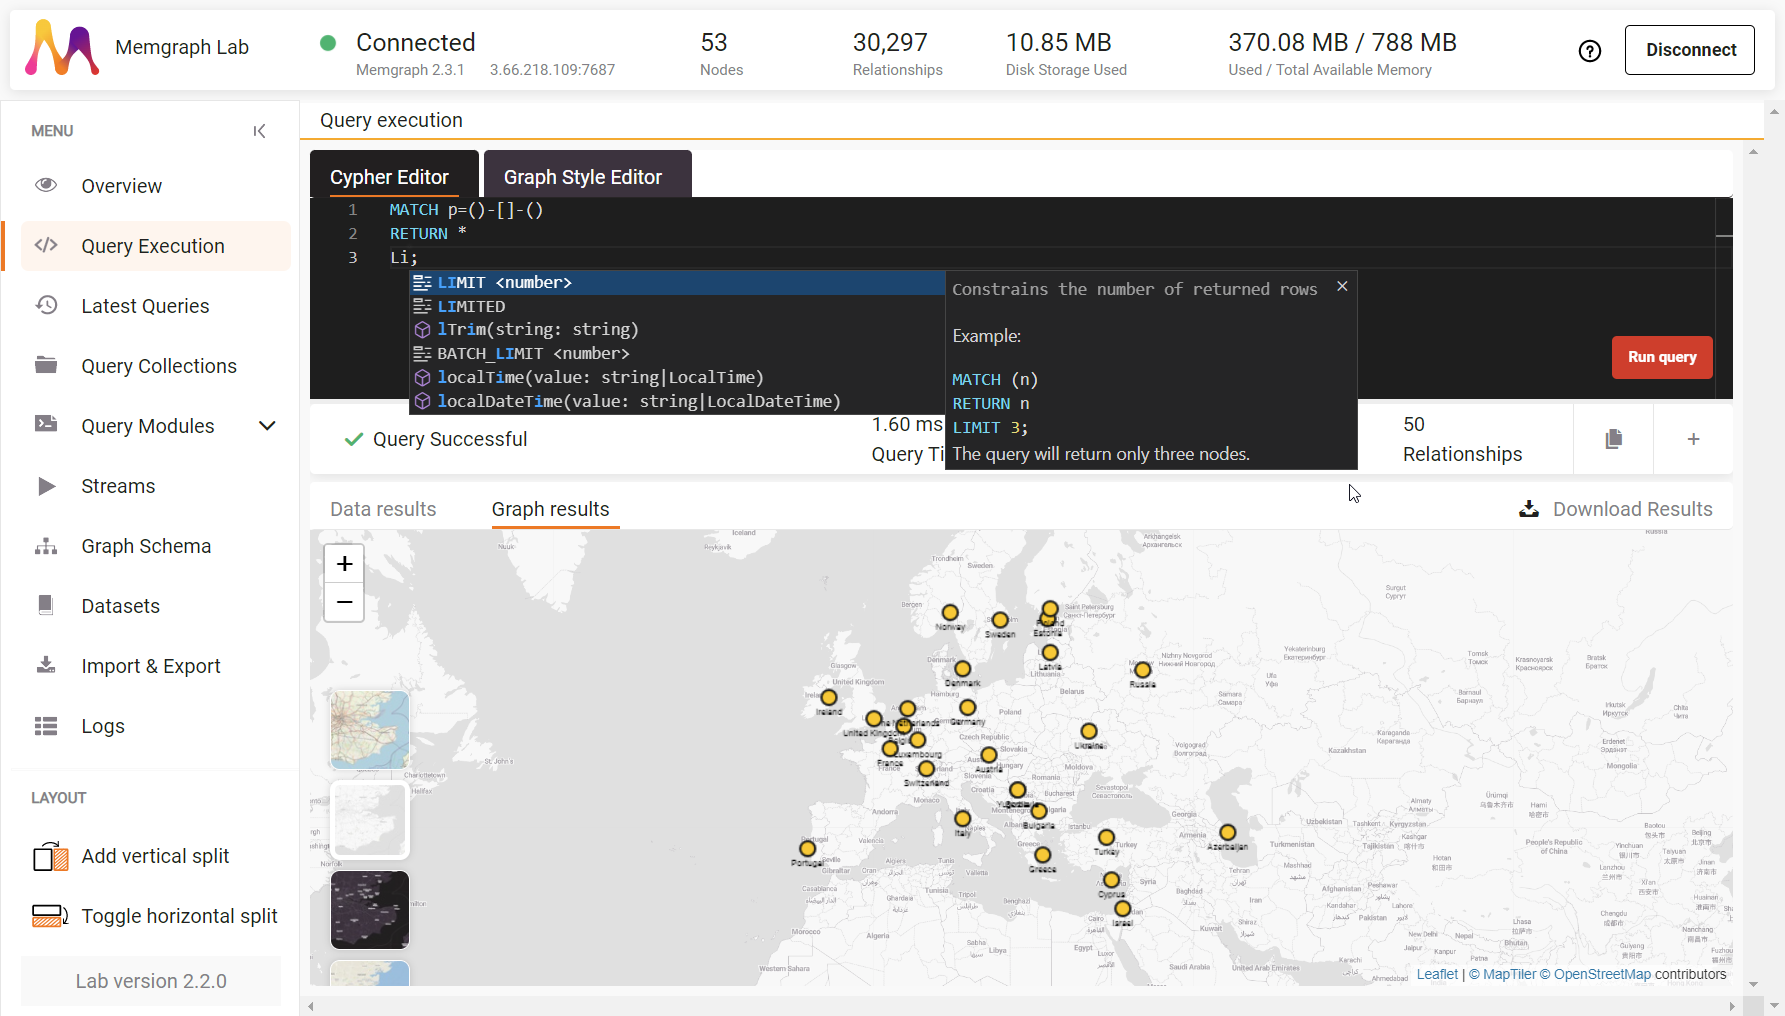
Here is where you write and run your Cypher queries. A keyword suggestion tool can help you with clause completion and give information about signatures and parameters. If you need help writing Cypher queries, check out the Cypher manual.
Once you Run a query (by clicking a button or pressing CTRL + Enter), you can Cancel it, but if the query has already reach MemgraphDB, the action won't actually stop the query's execution. In the case of running complex algorithms on a large dataset, you need to be a bit patient and wait for Memgraph to complete running the query.
Here you can also copy the query to your clipboard or add it to an existing or new query collection.
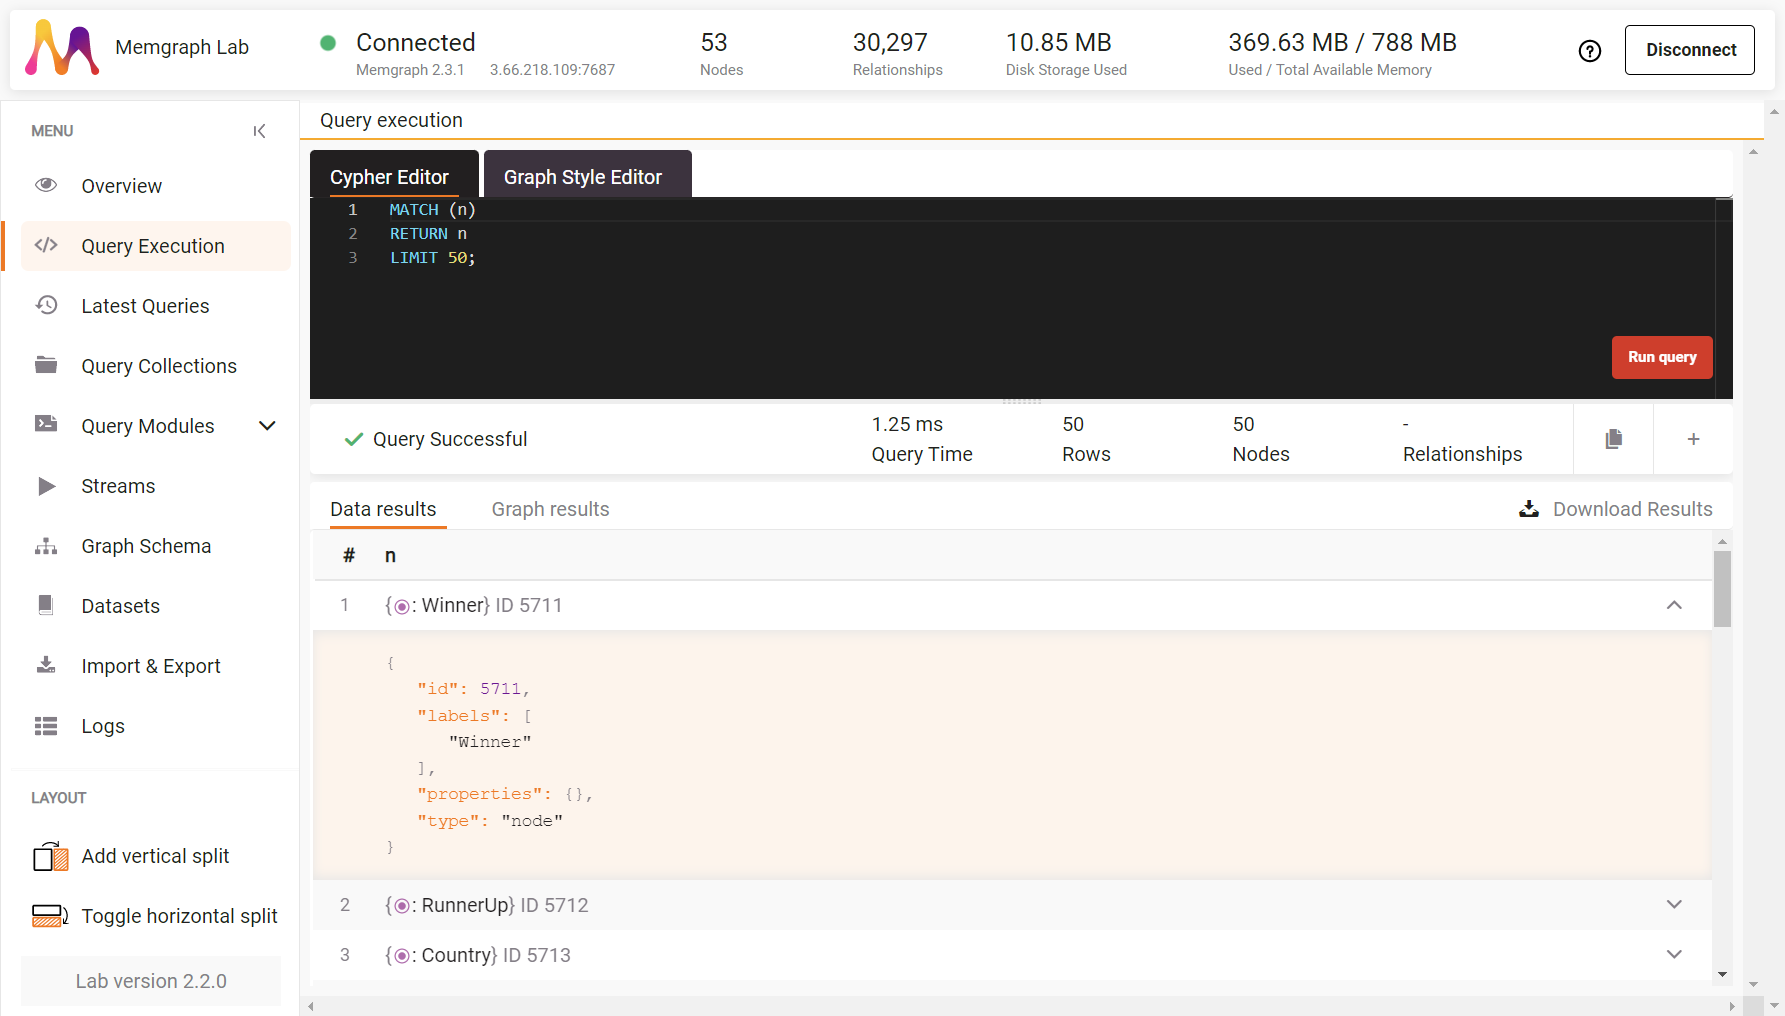
Data results
When the query has executed or failed, below the Cypher editor, you can see a Query successful message or an error. In the case of successful execution, you can also find out query execution time, rows the query generated as well as nodes and relationship the query returned (if any).
Depending on the results generated by the query, they can be shown in a table, as a graph, or both.
Here, you can also Download Results in JSON format.
Table rows can be expanded to show additional information about entities.
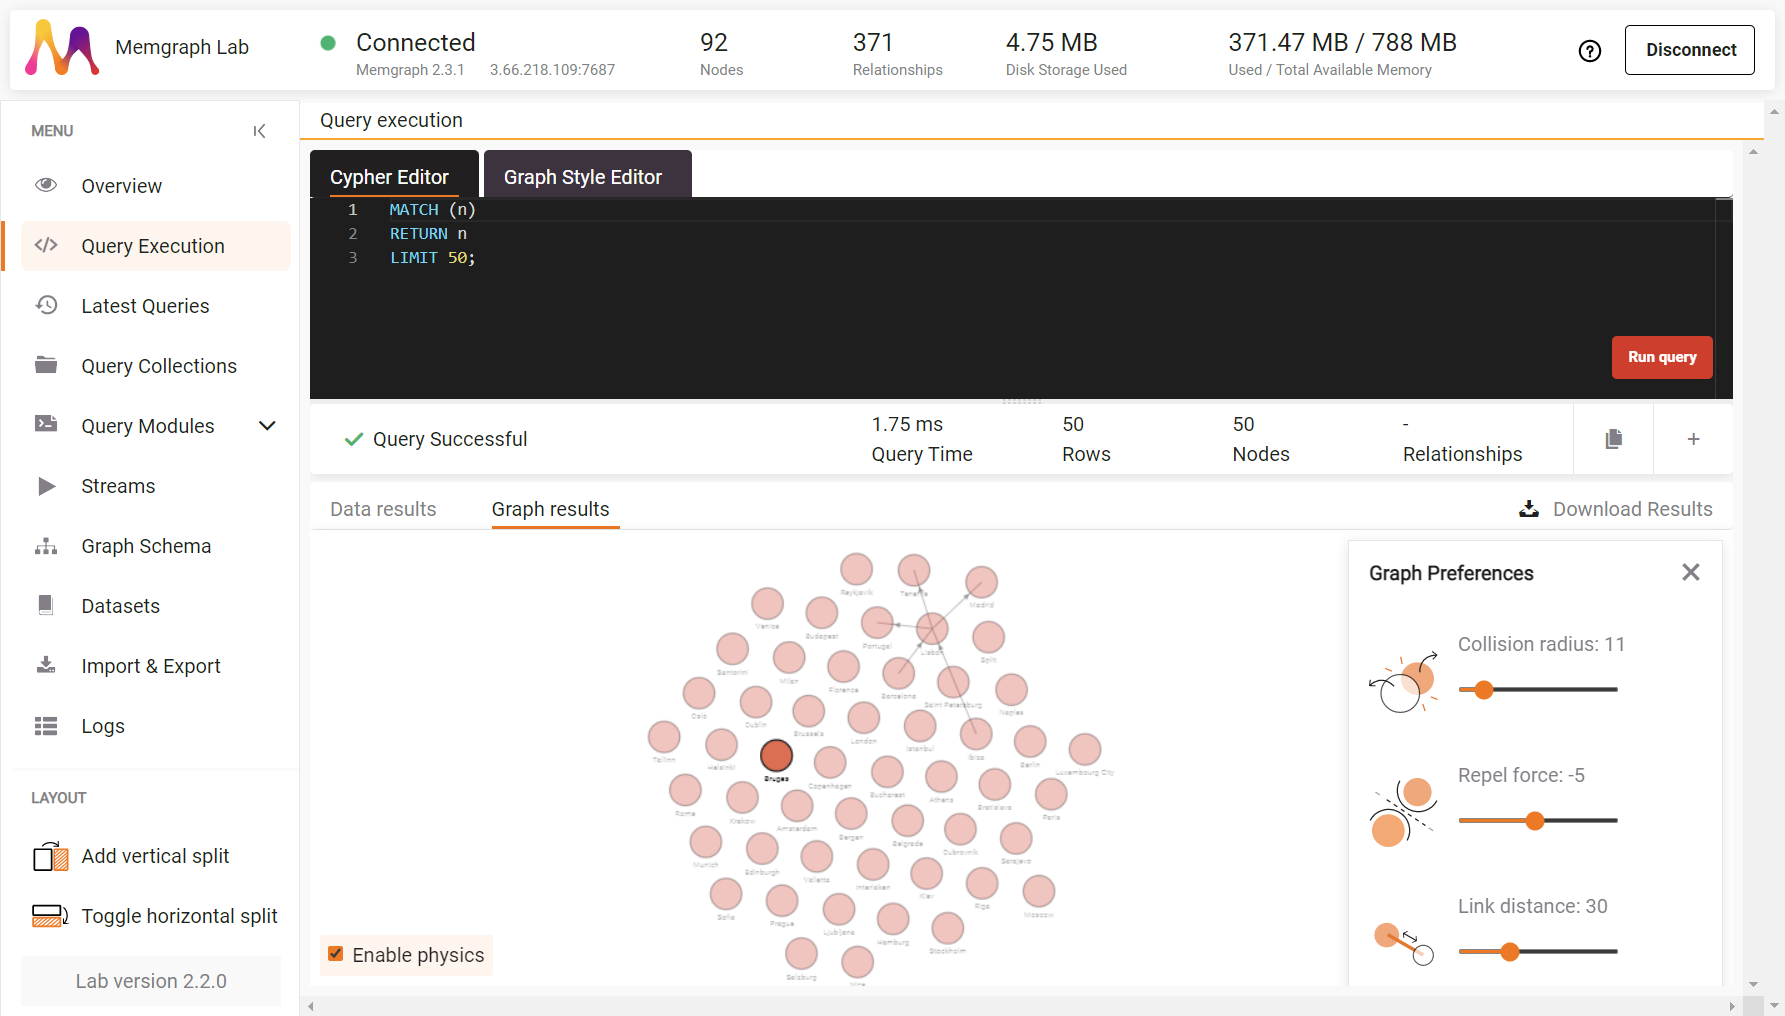
When results are shown as a graph, you can click on each node or relationship to see additional information. You can also Expand a node to see its relationships, Collapse a node to hide its relationships, or Hide the node from the canvas.
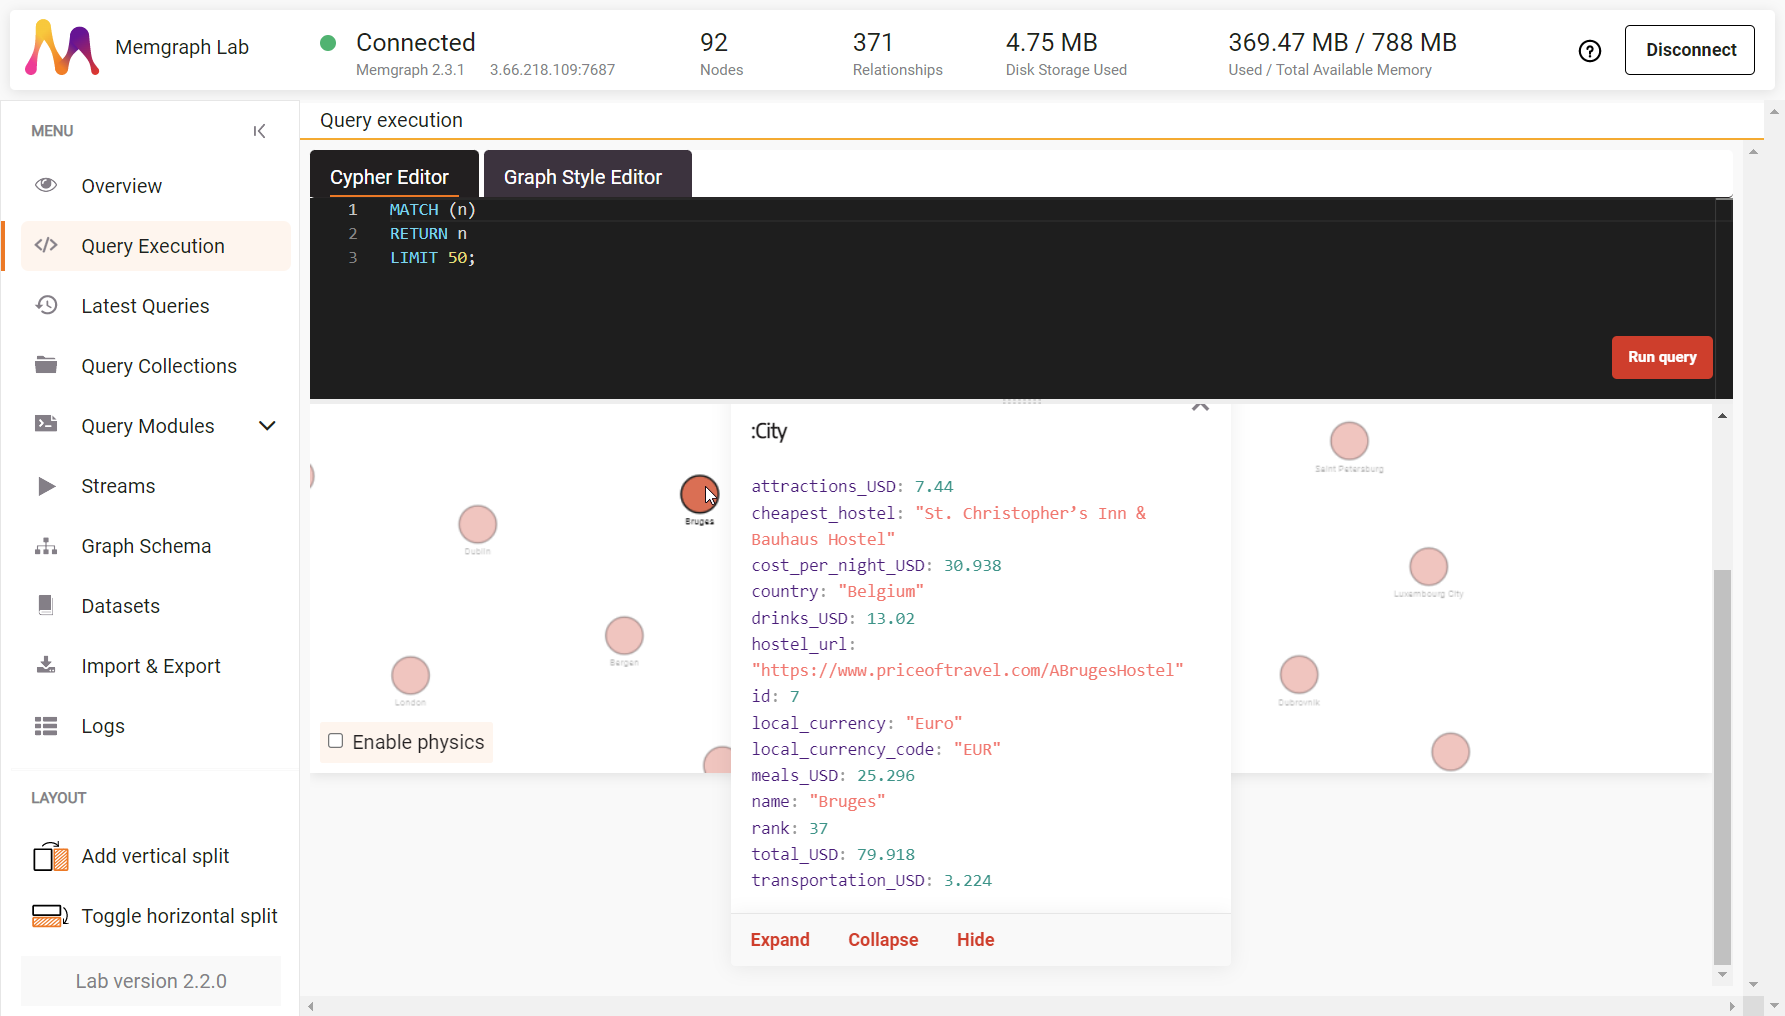
In the bottom left corner, you can Enable physics, that is, make nodes interact with each other, by pulling away or closing in to one another, depending on the strength of the relationships between them.
In the top right corner of the graph you can open Graph Preferences and set the collision radius that dictates the margin radius for each node from its center, the repel force that dictates how strongly nodes repel each other, and the link distance that dictates the minimum required distance between two connected nodes.
Graphs can be additionally styled by using the Graph Style Editor. By using a language especially designed to style the visual appearance of graphs, you can change color, size, and shape of graph elements, even add pictures or backgrounds.
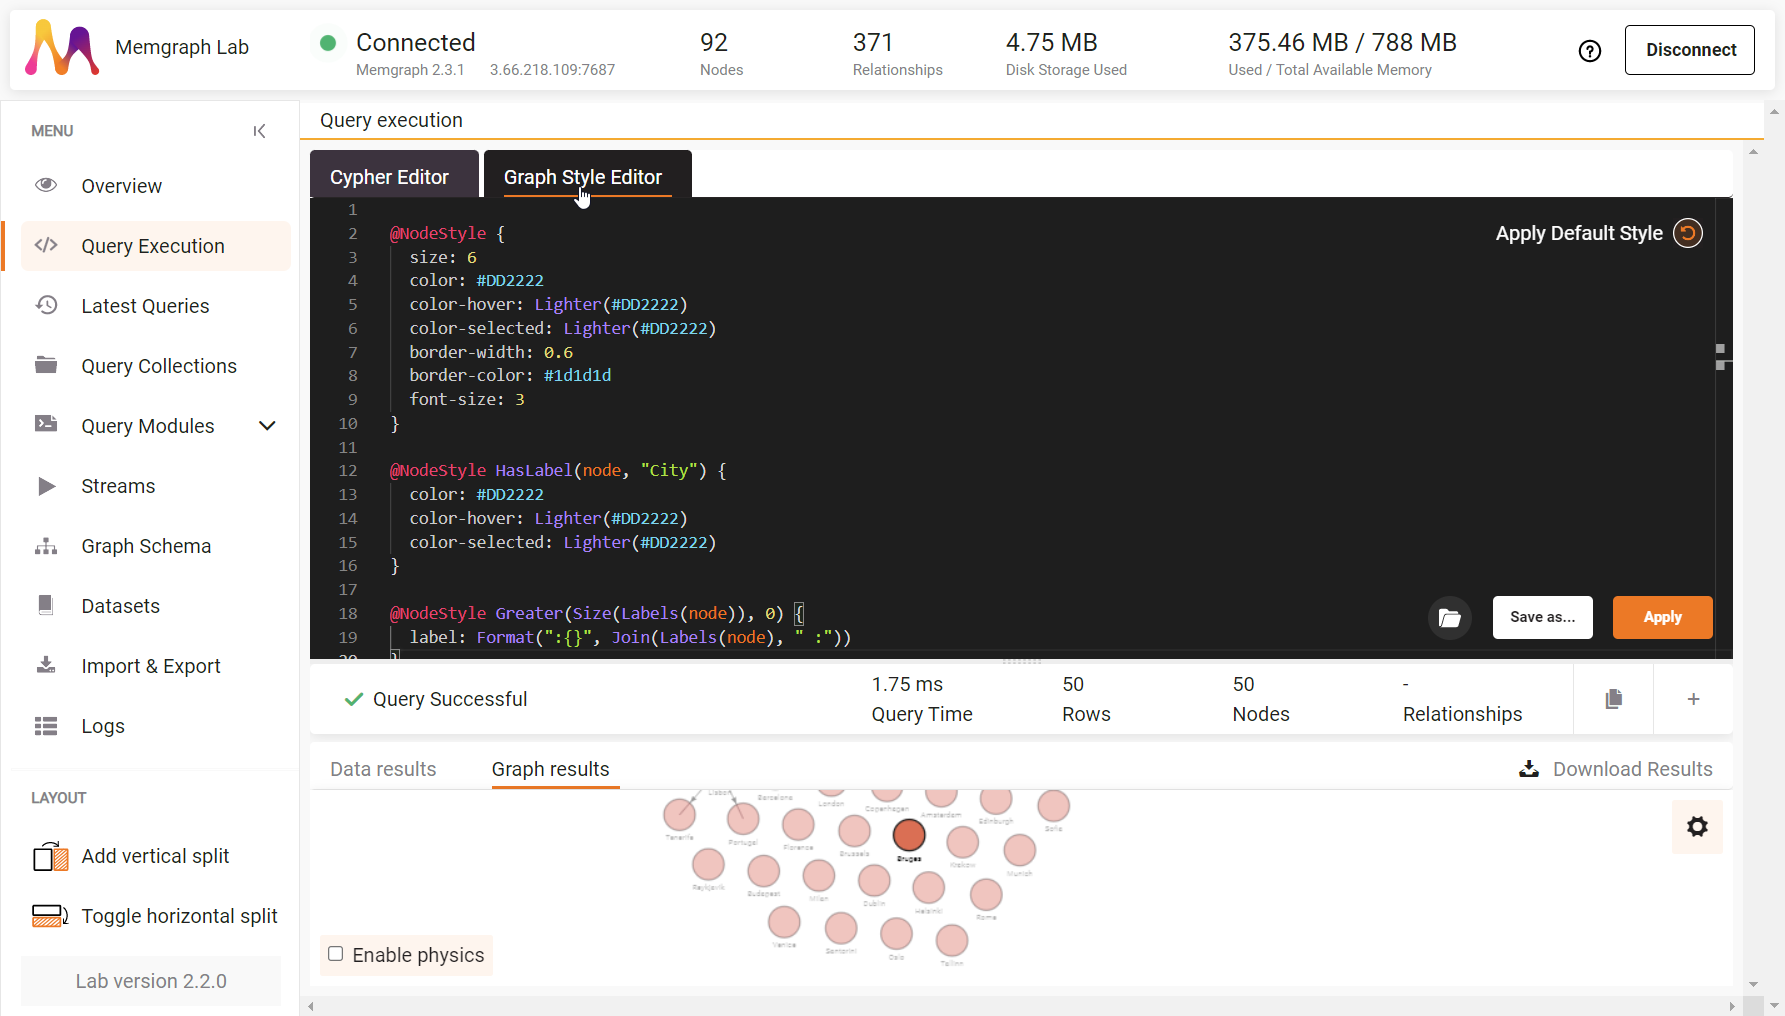
Be sure to check the GSS reference guide and a tutorial on how to style your graphs.
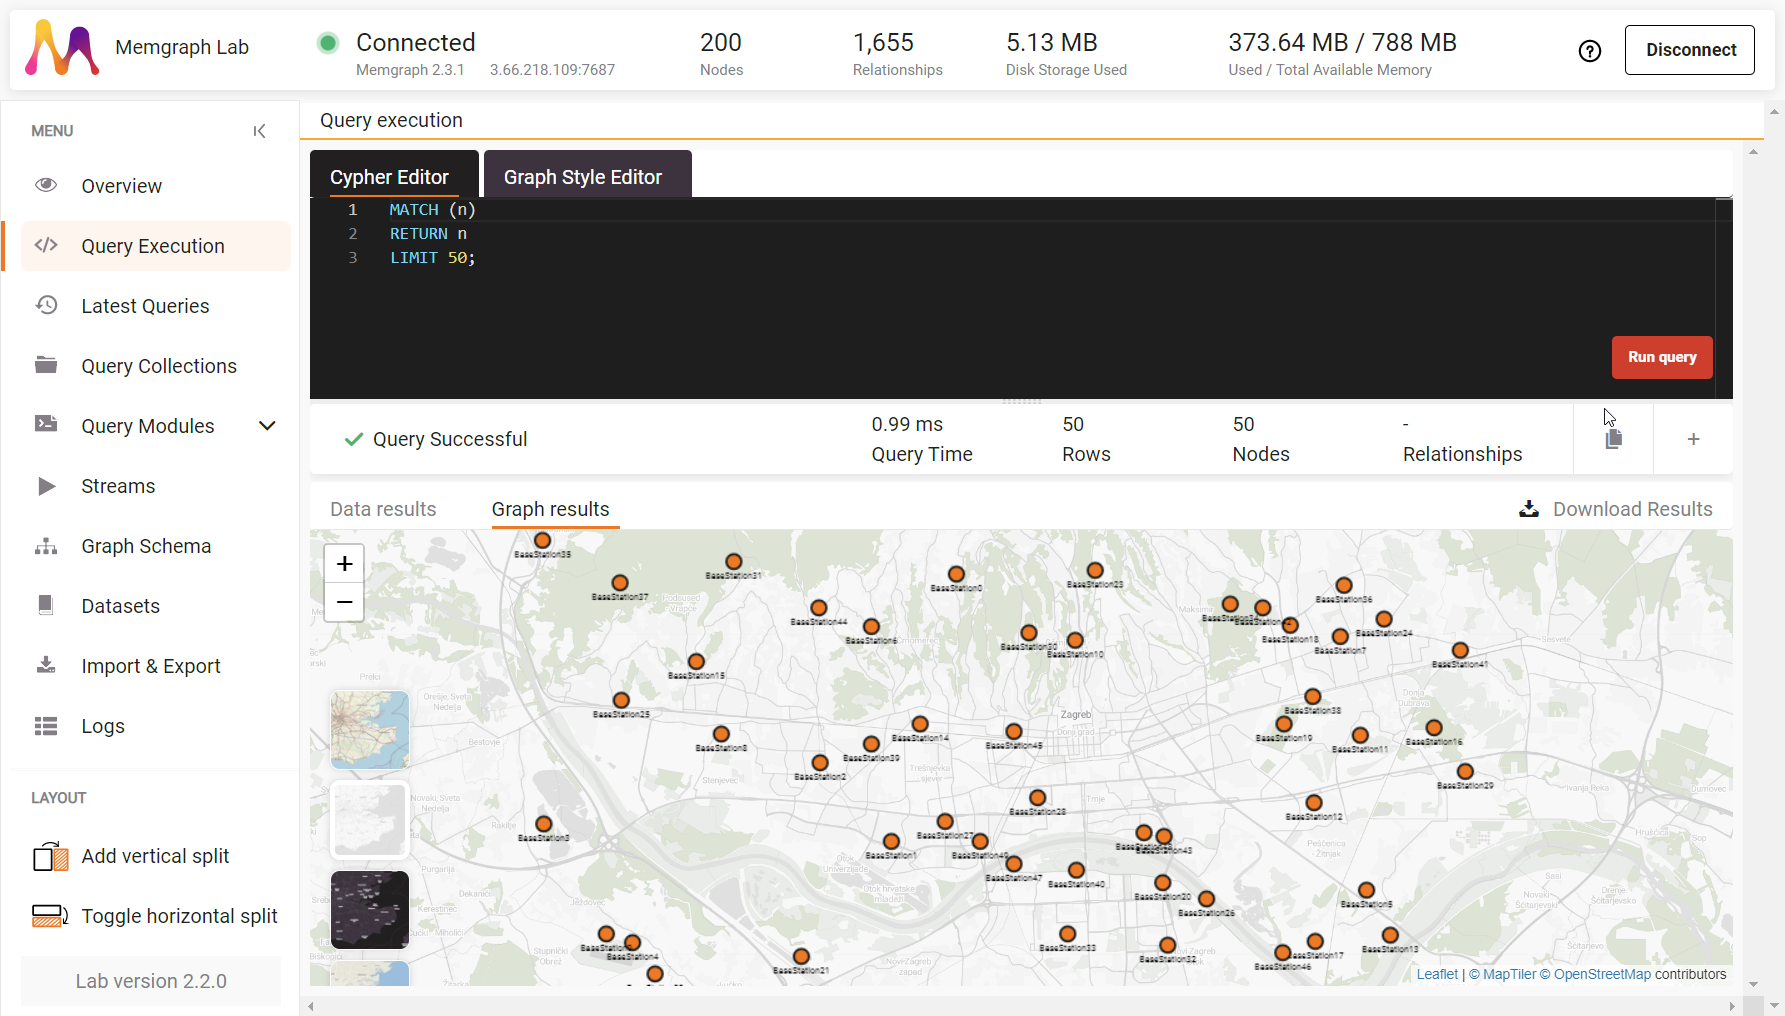
Another interesting feature you can use on graph data results is the map
background. This feature automatically turns on when the result nodes have
numeral lat and lng properties.
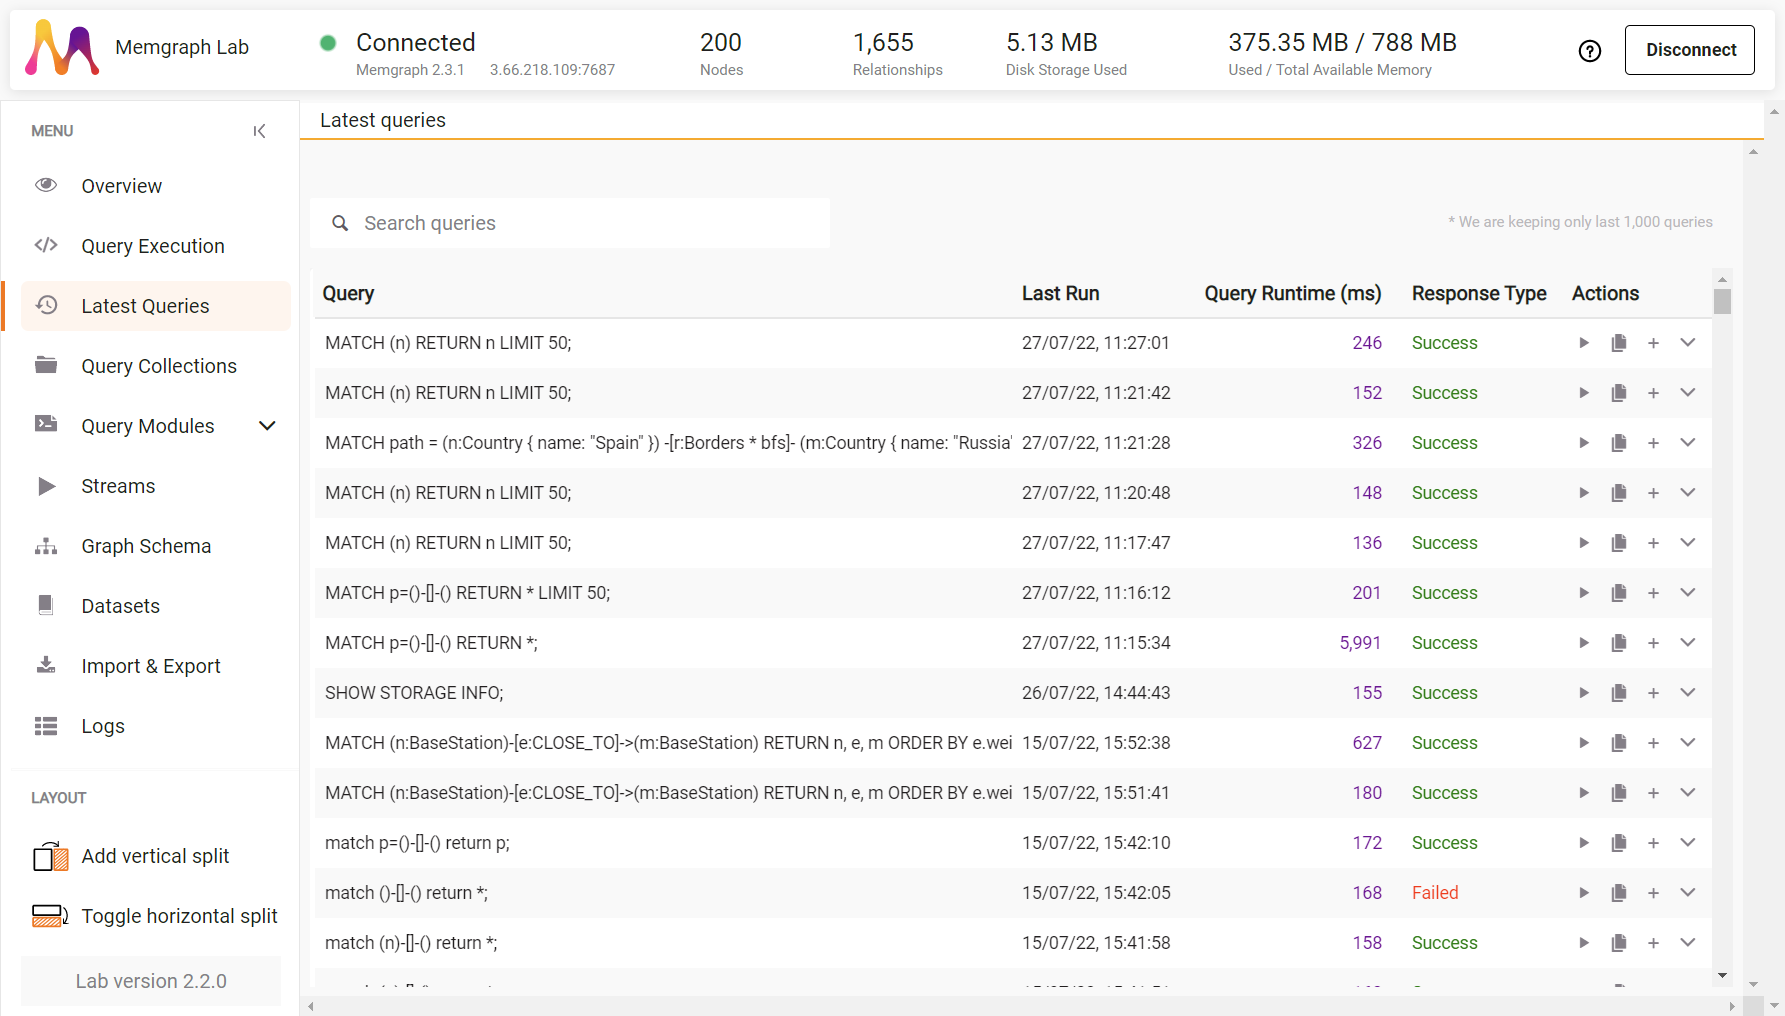
Latest Queries
Here you can search or view the last 1000 queries, with the information of their last run, runtime and whether they were successful or not.
From this section you can run them again, copy them into clipboard, and save them to an existing or new collection.
Query Collections
In the query collections, you can gather your favorite queries so they are always at hand.
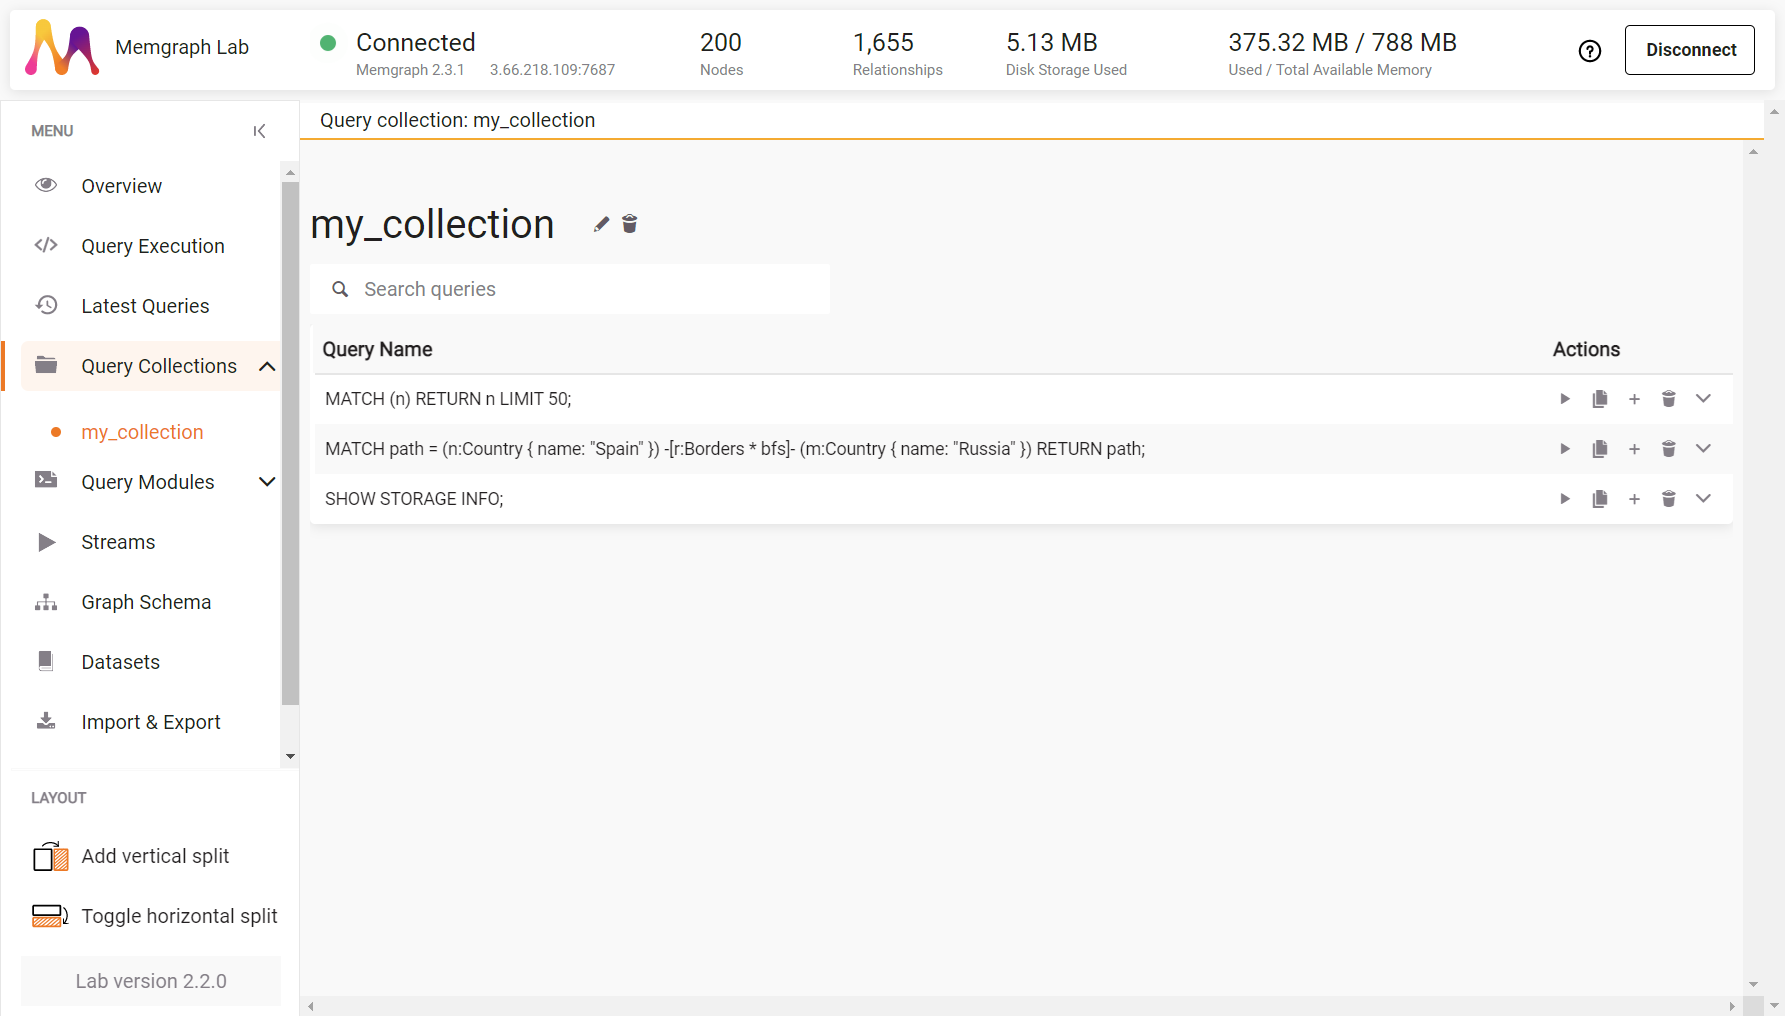
Queries can be added to the collection from the Query Execution and the Latest Queries section.
From the Query Collections section, you can directly run queries, copy them into the clipboard, and save them to an existing or a new collection.
Query Modules
Query modules are
collections of procedures written in C, C++, Python, and Rust
(either *.so or *.py files) to extend the query language. Transformation
procedures necessary to ingest data from data streams are also written as query
modules.
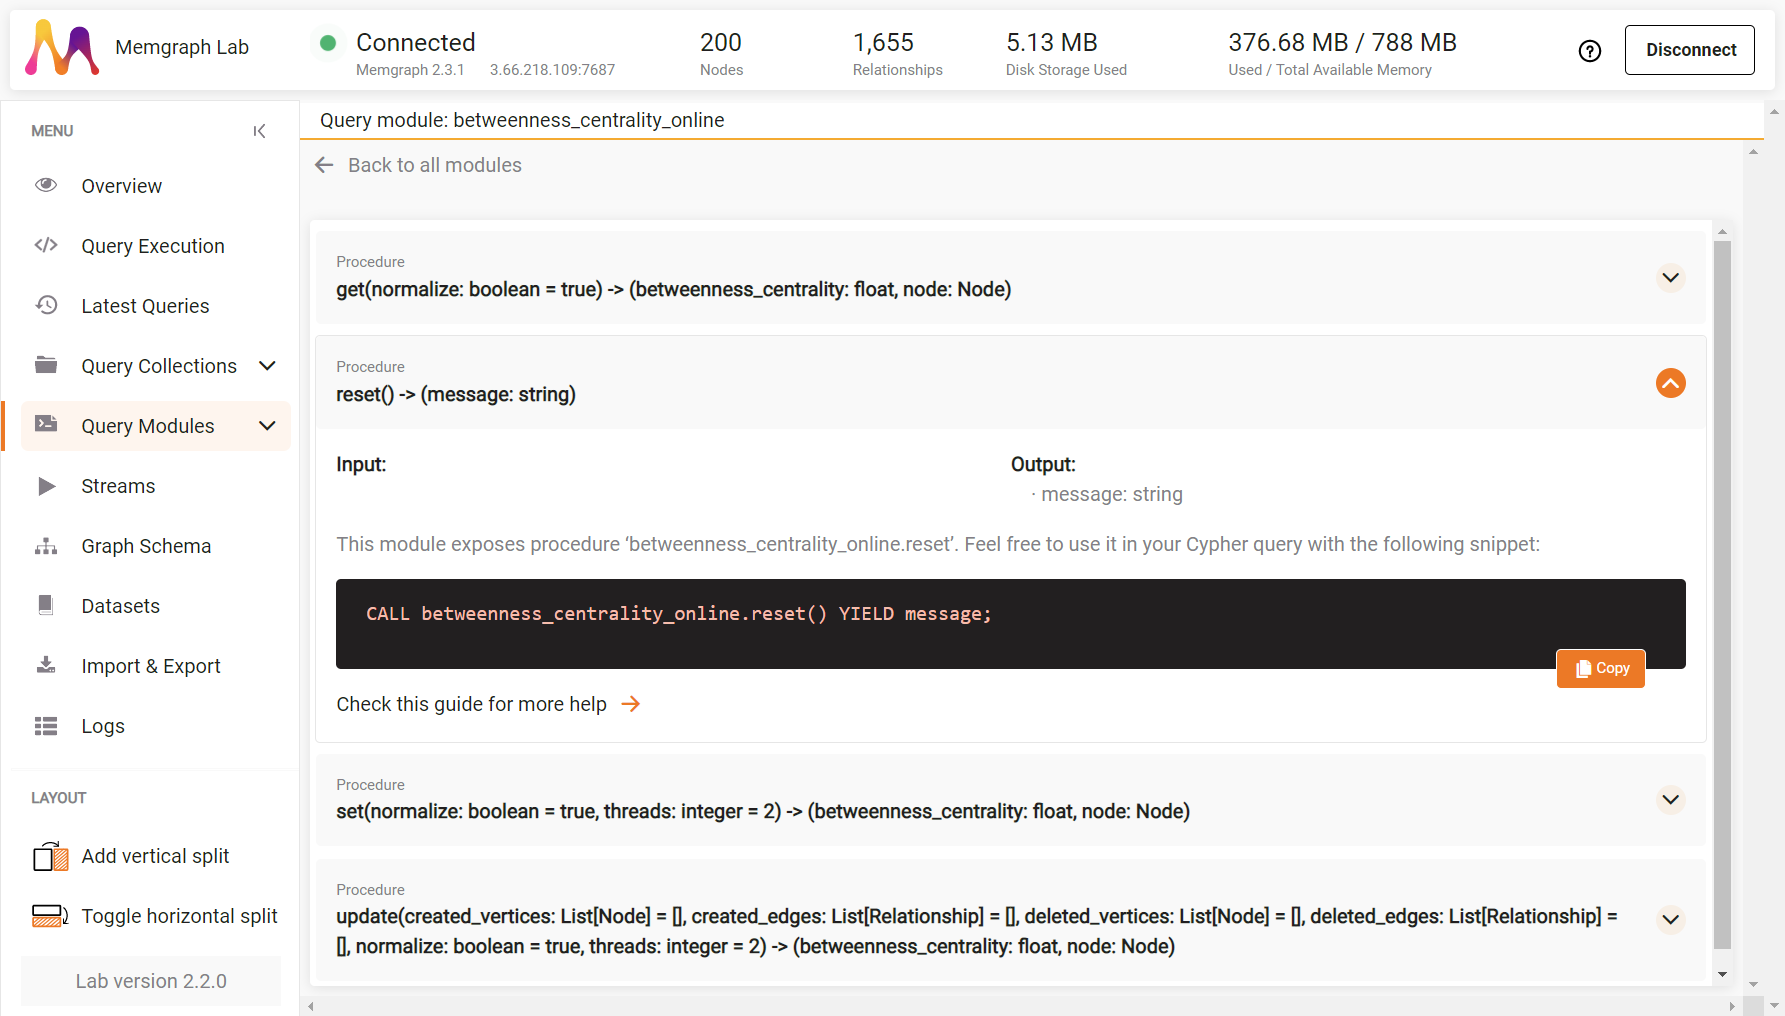
Some query modules are built-in, and others, like those that can help you solve complex graph issues, are available as part of the MAGE library you can add to your Memgraph installation. The library is already included if you are using Memgraph Platform or Memgraph MAGE Docker images to run Memgraph, or you are connecting to a Cloud instance.
All the query modules and procedures are listed in the Query Modules section. By expanding the information about each query module, you can see the procedures it contains, as well as their signatures and examples.
In this section, you can also implement your own custom query modules written in Python by clicking on the + New Module. A new file will open with example procedures you can examine and learn from. Once you have written and saved the query module, Memgraph Lab will automatically detect procedures within it, which you can then call from queries.
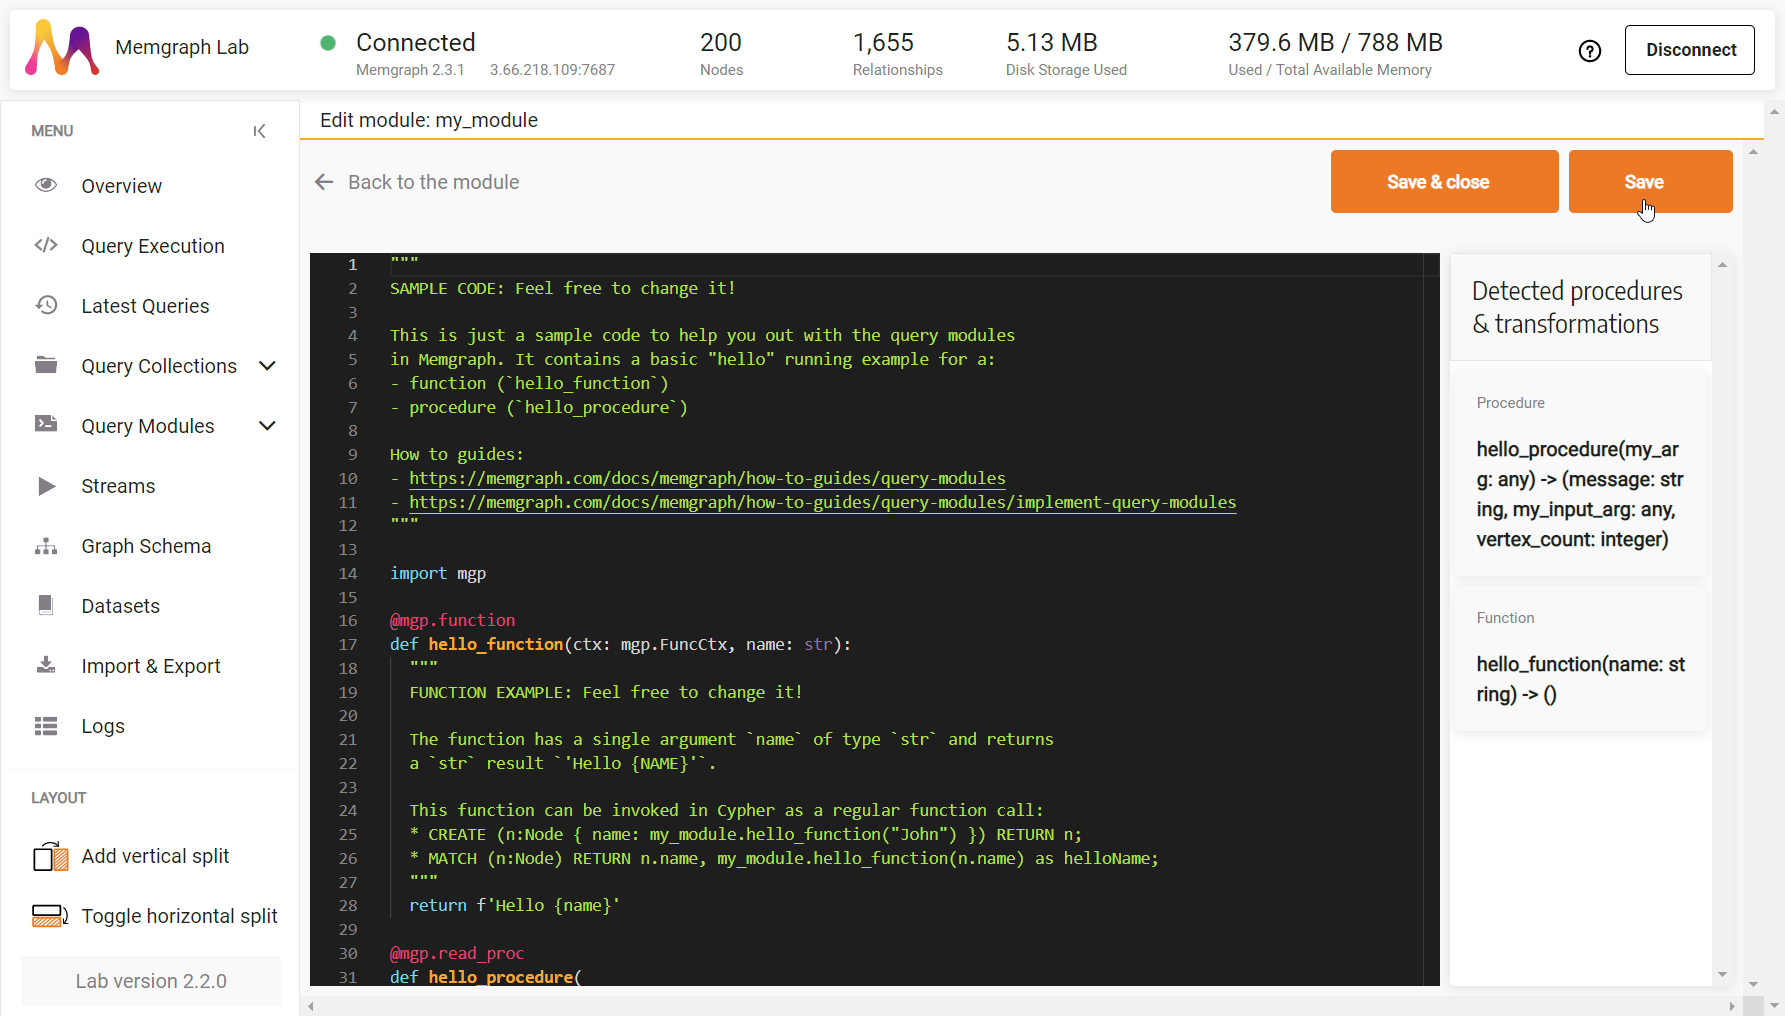
If you need help writing custom query modules, check out the reference guide, or a tutorial on query modules.
Streams
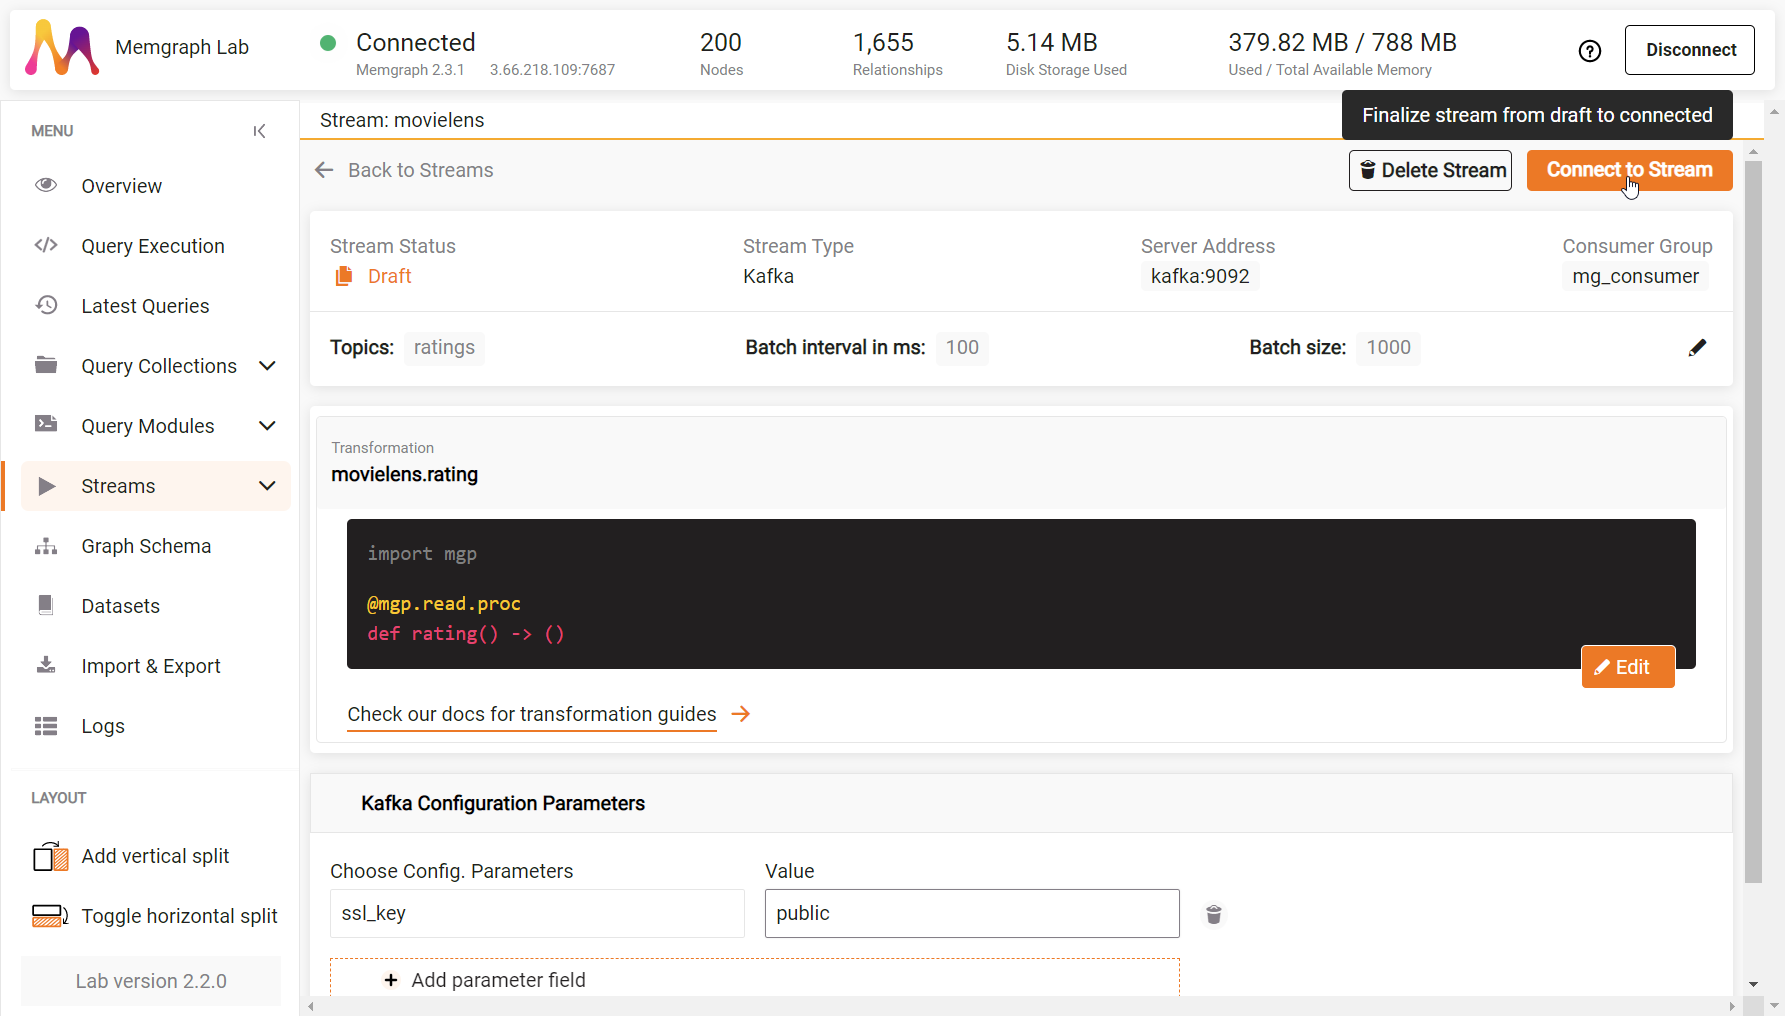
In Memgraph Lab, you can connect to a data stream by running a series of Cypher queries or you can connect to it using the Streams section.
Once you enter basic information about the stream, such as type, name, server address and topics, the Streams section allows you to add an existing query module containing transformation procedure or to write a new one in Python.
When saving a new query module, Memgraph Lab will automatically detect transformation procedures within it, which you can then attach to the created stream.
Adding Kafka Configuration Parameters is also done via the Stream section, as well as managing the connection - starting, pausing or deleting it.
Check out the reference guide on streams, and check a how-to guide on connecting to data streams from Memgraph Lab.
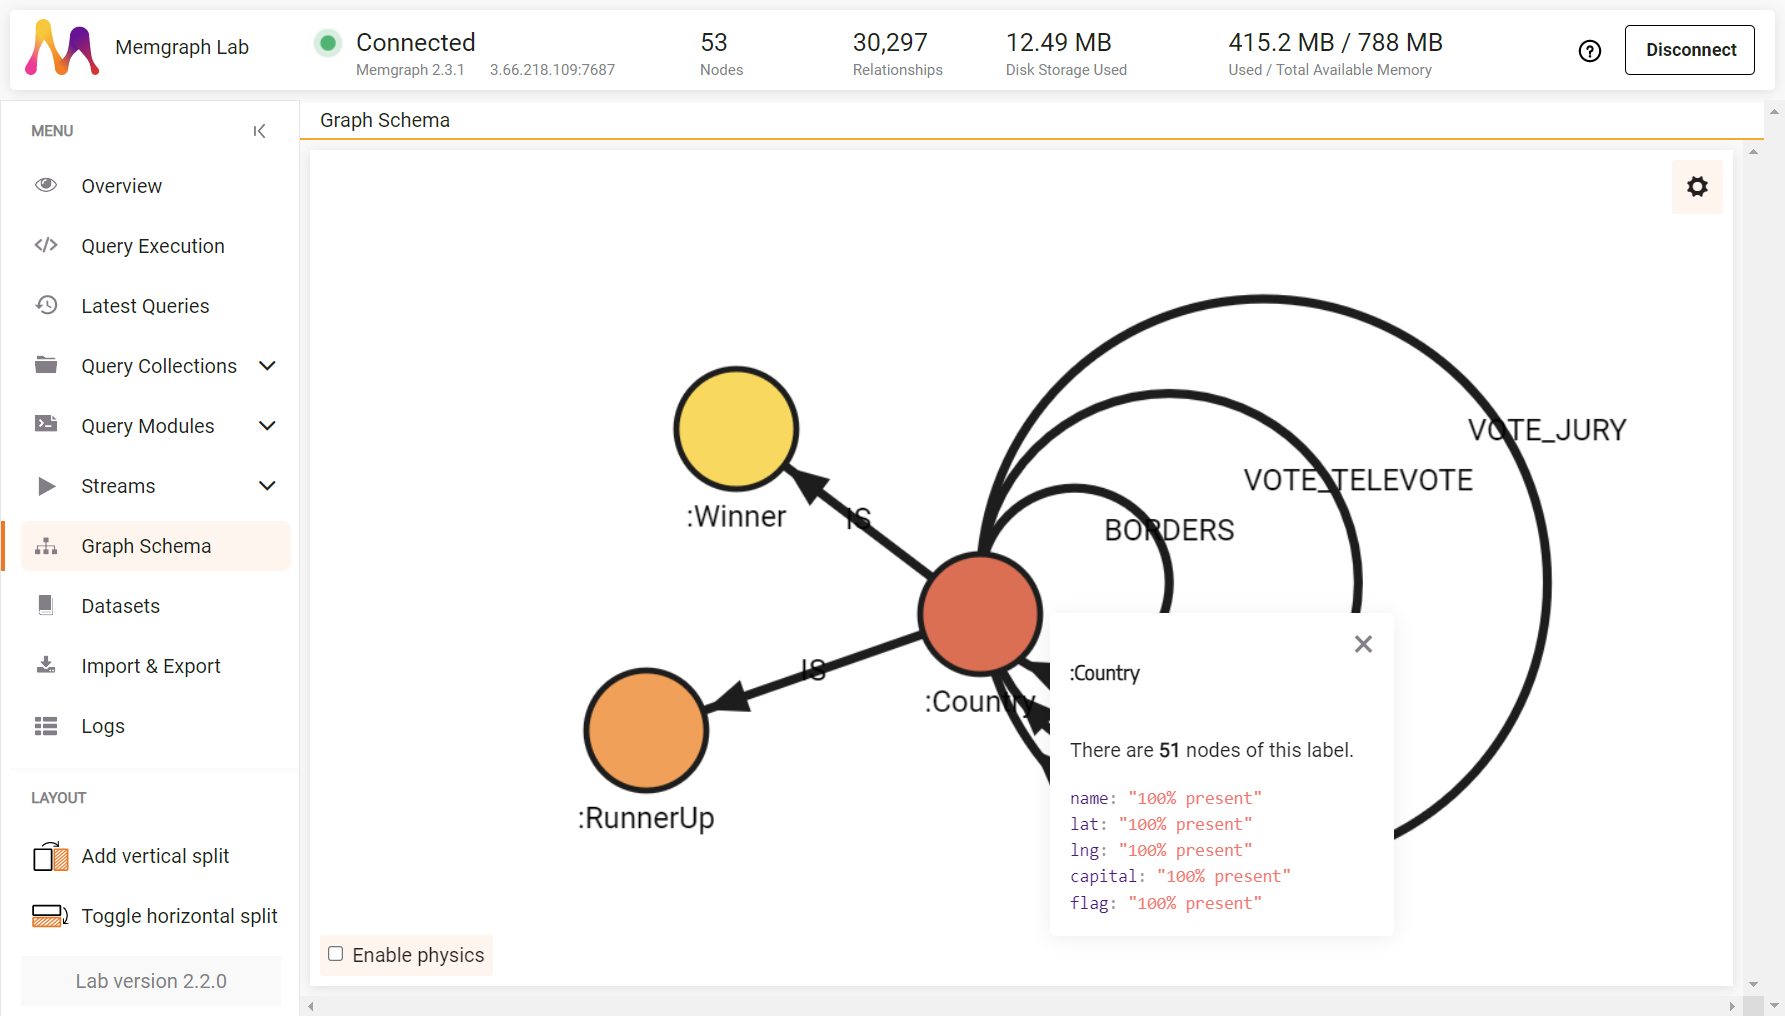
Graph Schema
If you need to check the data model of the data currently in the database, you can generate a graph schema that will show all the node types and relationships between them.
By selecting a certain node or relationship type, Lab will provide information about the current number of nodes or relationships of that type, as well as percentage of existence of each property across the nodes and relationships of that type.
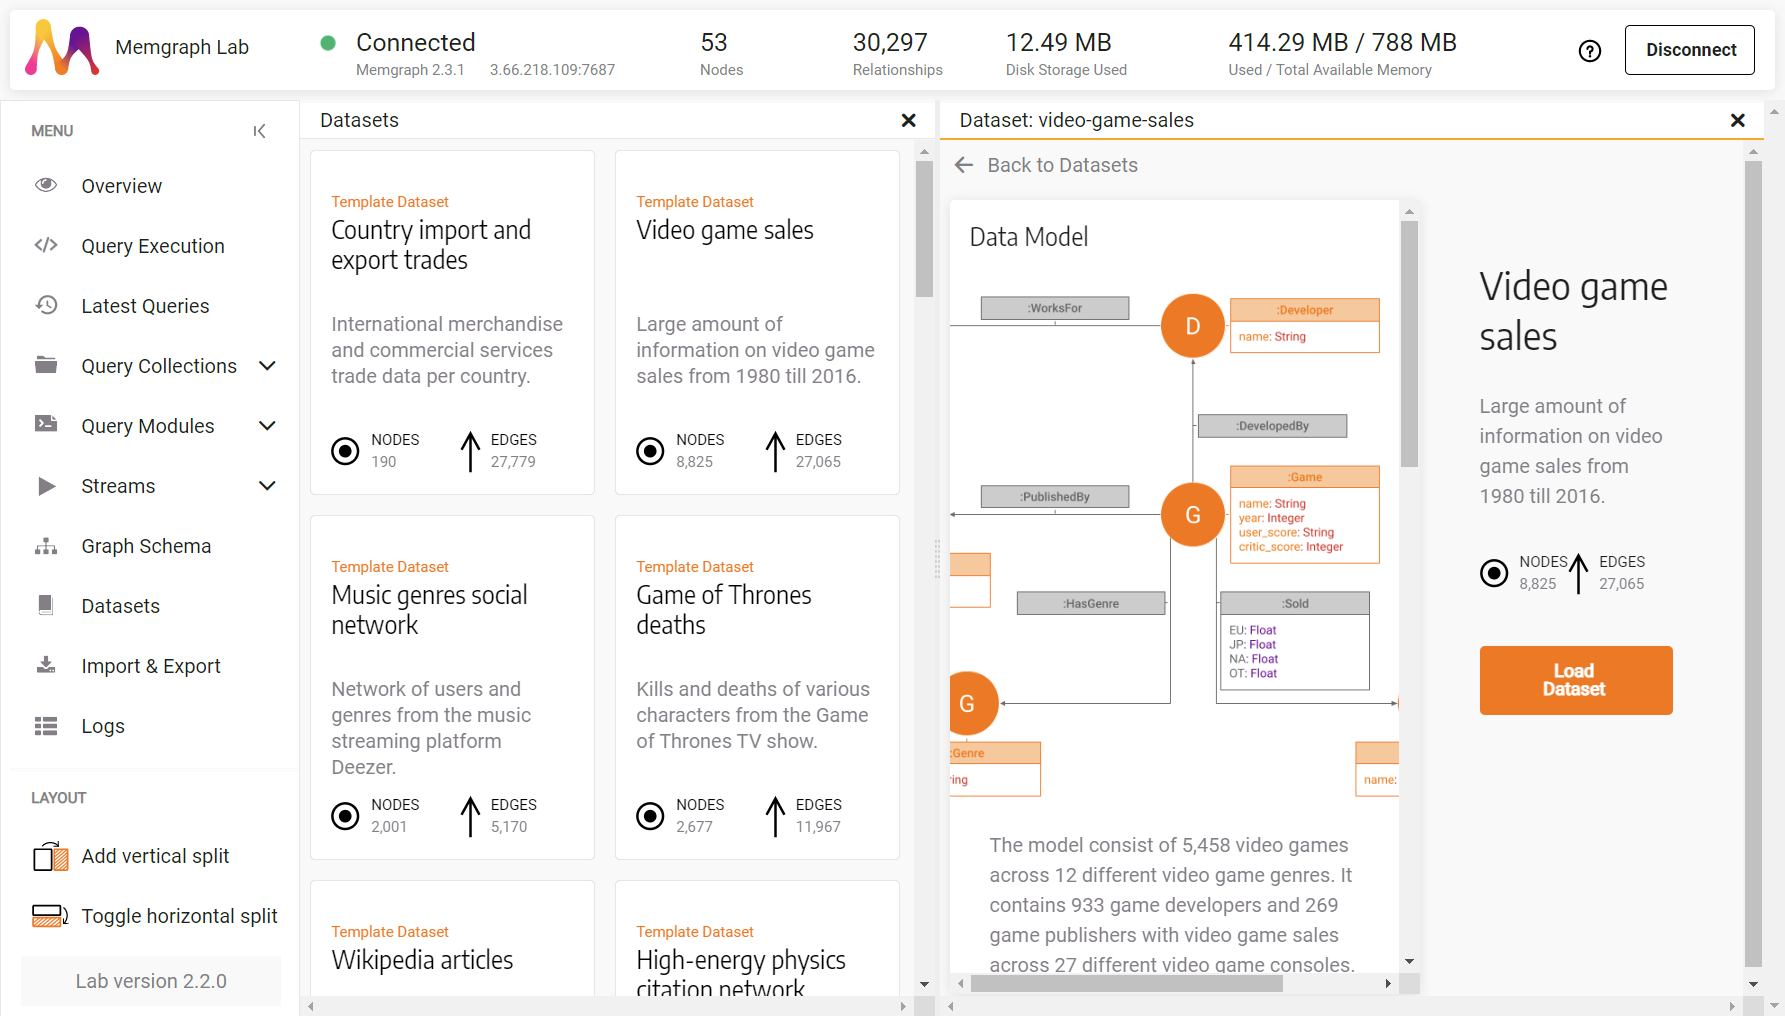
Datasets
From the Datasets section, you can load interesting datasets varying in topics and size. You can use the datasets to explore the Cypher query language and Memgraph Lab features, or to experiment with data before you tackle your own more complex issues.
You can check the structure of the dataset by checking its graph schema, as well as reading the explanations of all the entities and their properties.
There are several tutorials you can use to explore the datasets available in Memgraph Lab.
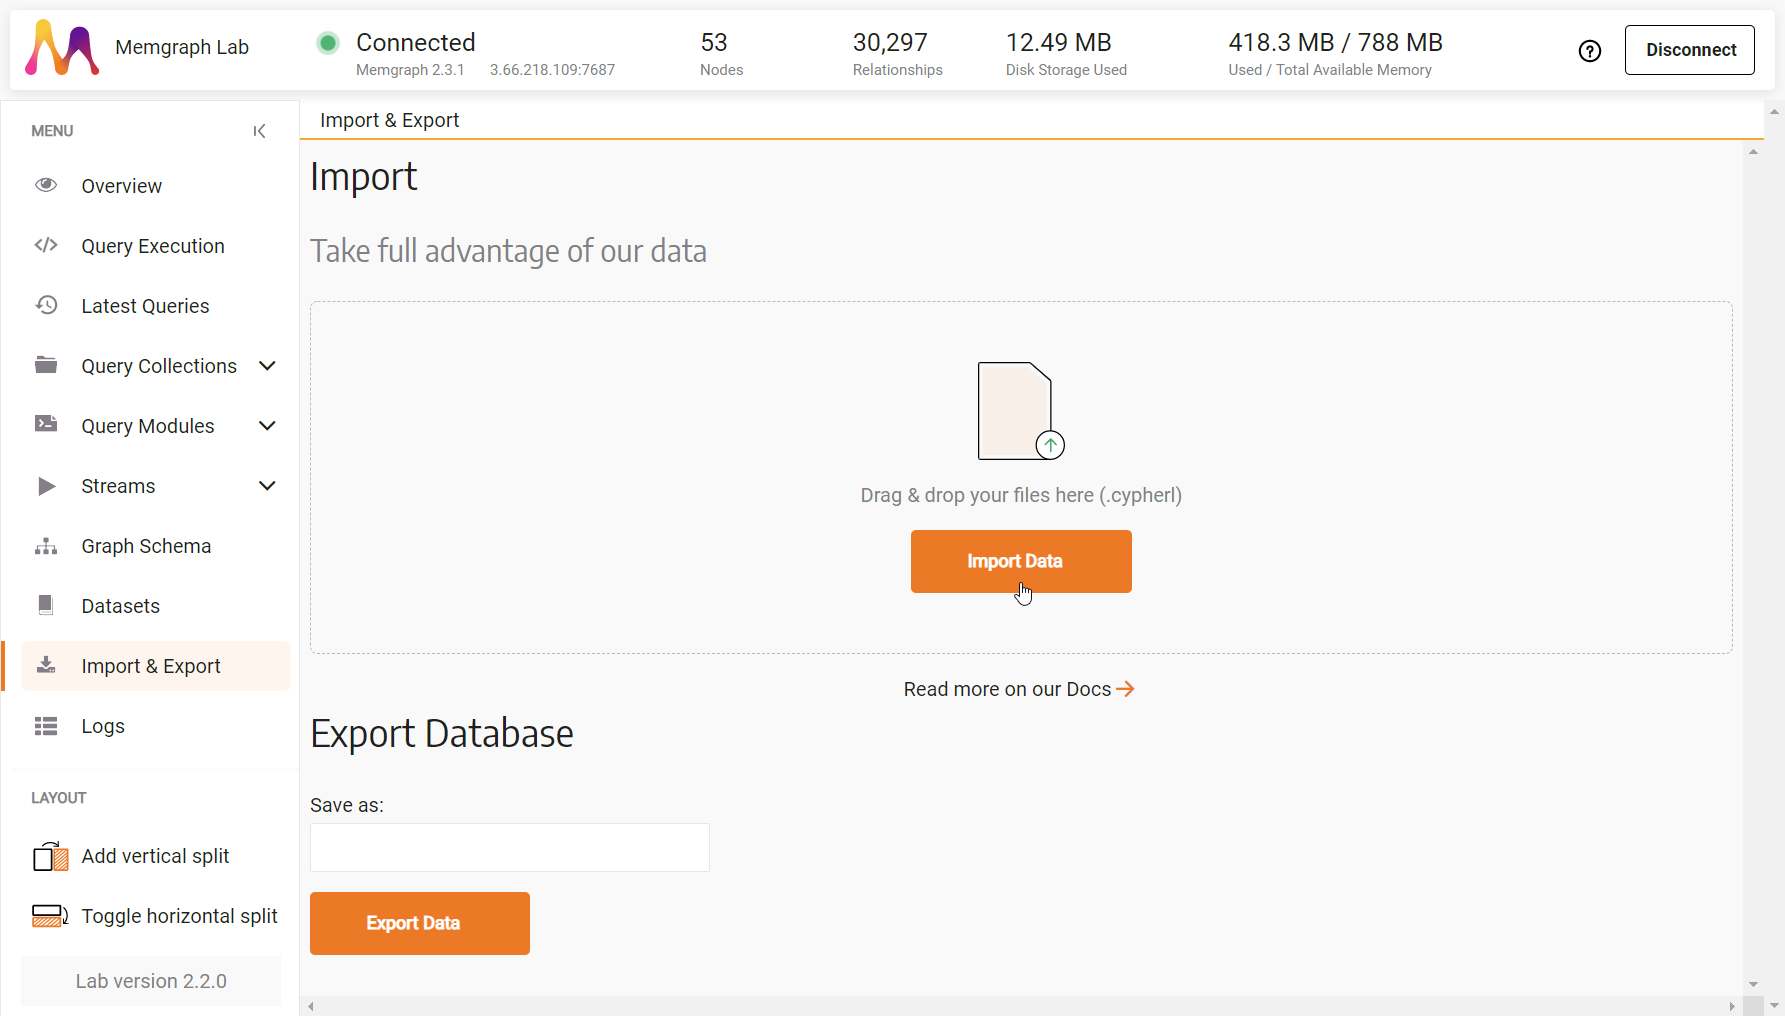
Import & Export
In this section, you can import and export data in CYPHERL format, which represents data in the form of Cypher queries.
To import data from other sources, check the guides on importing.
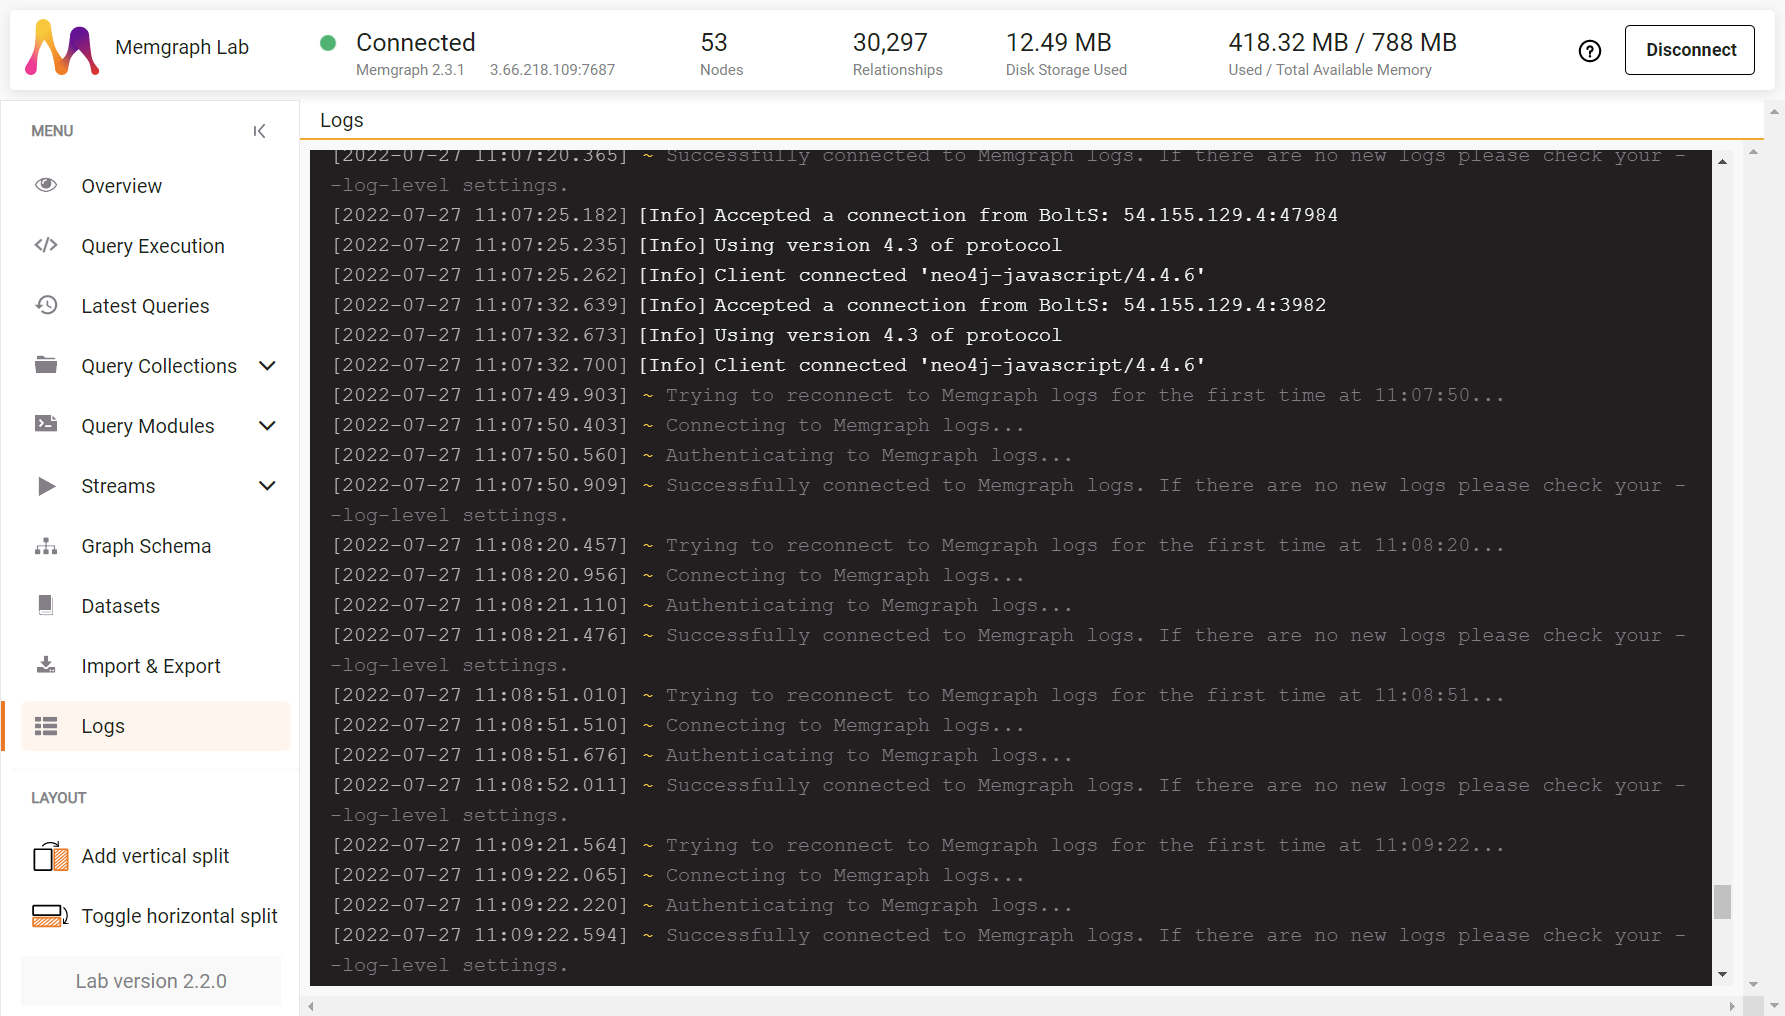
Logs
To be able to see logs from Memgraph Lab you need to open port 7444 when starting Memgraph with Docker.
Check the reference guide on configuration regarding logs to check how to modify logging, and the how-to guide on how to access logs if you are not using Docker.
Layout
You can split the work area horizontally to work with 2 sections at the same time, or vertically to work with up to 5 sections simultaneously.
You can also combine the horizontal and vertical split.
Memgraph Lab demo video
As a part of the Memgraph Cloud release, we've showcased different features of Memgraph Lab, and we invite you to check it out!
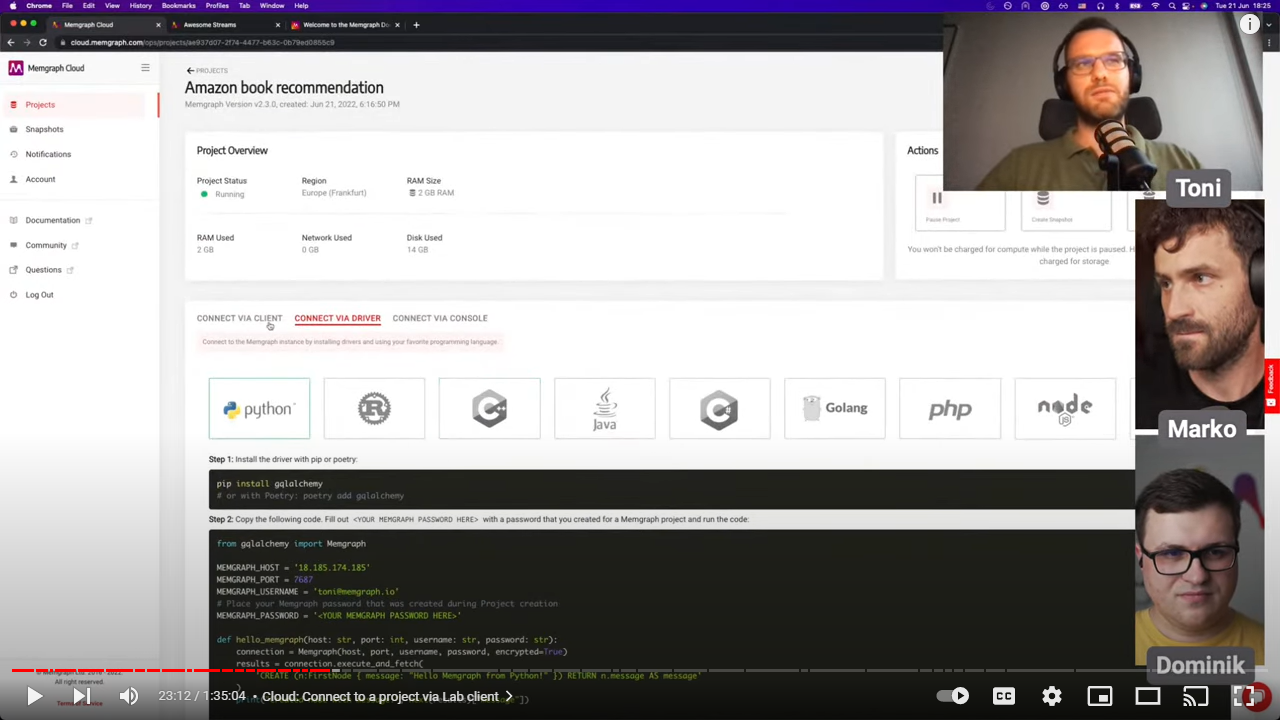
If you are interested in a particular topic, below is the breakdown of the video by the topics covered in the user manual, but there is a breakdown in the description of the video as well: