- What is Elasticsearch?
- What’s new in 8.10
- Set up Elasticsearch
- Installing Elasticsearch
- Run Elasticsearch locally
- Configuring Elasticsearch
- Important Elasticsearch configuration
- Secure settings
- Auditing settings
- Circuit breaker settings
- Cluster-level shard allocation and routing settings
- Miscellaneous cluster settings
- Cross-cluster replication settings
- Discovery and cluster formation settings
- Field data cache settings
- Health Diagnostic settings
- Index lifecycle management settings
- Data stream lifecycle settings
- Index management settings
- Index recovery settings
- Indexing buffer settings
- License settings
- Local gateway settings
- Logging
- Machine learning settings
- Monitoring settings
- Node
- Networking
- Node query cache settings
- Search settings
- Security settings
- Shard request cache settings
- Snapshot and restore settings
- Transforms settings
- Thread pools
- Watcher settings
- Advanced configuration
- Important system configuration
- Bootstrap Checks
- Heap size check
- File descriptor check
- Memory lock check
- Maximum number of threads check
- Max file size check
- Maximum size virtual memory check
- Maximum map count check
- Client JVM check
- Use serial collector check
- System call filter check
- OnError and OnOutOfMemoryError checks
- Early-access check
- G1GC check
- All permission check
- Discovery configuration check
- Bootstrap Checks for X-Pack
- Starting Elasticsearch
- Stopping Elasticsearch
- Discovery and cluster formation
- Add and remove nodes in your cluster
- Full-cluster restart and rolling restart
- Remote clusters
- Plugins
- Upgrade Elasticsearch
- Index modules
- Mapping
- Text analysis
- Overview
- Concepts
- Configure text analysis
- Built-in analyzer reference
- Tokenizer reference
- Token filter reference
- Apostrophe
- ASCII folding
- CJK bigram
- CJK width
- Classic
- Common grams
- Conditional
- Decimal digit
- Delimited payload
- Dictionary decompounder
- Edge n-gram
- Elision
- Fingerprint
- Flatten graph
- Hunspell
- Hyphenation decompounder
- Keep types
- Keep words
- Keyword marker
- Keyword repeat
- KStem
- Length
- Limit token count
- Lowercase
- MinHash
- Multiplexer
- N-gram
- Normalization
- Pattern capture
- Pattern replace
- Phonetic
- Porter stem
- Predicate script
- Remove duplicates
- Reverse
- Shingle
- Snowball
- Stemmer
- Stemmer override
- Stop
- Synonym
- Synonym graph
- Trim
- Truncate
- Unique
- Uppercase
- Word delimiter
- Word delimiter graph
- Character filters reference
- Normalizers
- Index templates
- Data streams
- Ingest pipelines
- Example: Parse logs
- Enrich your data
- Processor reference
- Append
- Attachment
- Bytes
- Circle
- Community ID
- Convert
- CSV
- Date
- Date index name
- Dissect
- Dot expander
- Drop
- Enrich
- Fail
- Fingerprint
- Foreach
- Geo-grid
- GeoIP
- Grok
- Gsub
- HTML strip
- Inference
- Join
- JSON
- KV
- Lowercase
- Network direction
- Pipeline
- Redact
- Registered domain
- Remove
- Rename
- Reroute
- Script
- Set
- Set security user
- Sort
- Split
- Trim
- Uppercase
- URL decode
- URI parts
- User agent
- Aliases
- Search your data
- Collapse search results
- Filter search results
- Highlighting
- Long-running searches
- Near real-time search
- Paginate search results
- Retrieve inner hits
- Retrieve selected fields
- Search across clusters
- Search multiple data streams and indices
- Search shard routing
- Search templates
- Search with synonyms
- Sort search results
- kNN search
- Semantic search
- Searching with query rules
- Query DSL
- Aggregations
- Bucket aggregations
- Adjacency matrix
- Auto-interval date histogram
- Categorize text
- Children
- Composite
- Date histogram
- Date range
- Diversified sampler
- Filter
- Filters
- Frequent item sets
- Geo-distance
- Geohash grid
- Geohex grid
- Geotile grid
- Global
- Histogram
- IP prefix
- IP range
- Missing
- Multi Terms
- Nested
- Parent
- Random sampler
- Range
- Rare terms
- Reverse nested
- Sampler
- Significant terms
- Significant text
- Terms
- Time series
- Variable width histogram
- Subtleties of bucketing range fields
- Metrics aggregations
- Pipeline aggregations
- Average bucket
- Bucket script
- Bucket count K-S test
- Bucket correlation
- Bucket selector
- Bucket sort
- Change point
- Cumulative cardinality
- Cumulative sum
- Derivative
- Extended stats bucket
- Inference bucket
- Max bucket
- Min bucket
- Moving function
- Moving percentiles
- Normalize
- Percentiles bucket
- Serial differencing
- Stats bucket
- Sum bucket
- Bucket aggregations
- Geospatial analysis
- EQL
- ES|QL
- Syntax reference
- Source commands
- Processing commands
- Functions
ABSACOSASINATANATAN2AUTO_BUCKETCASECEILCIDR_MATCHCOALESCECONCATCOSCOSHDATE_EXTRACTDATE_FORMATDATE_PARSEDATE_TRUNCEFLOORGREATESTIS_FINITEIS_INFINITEIS_NANLEASTLEFTLENGTHLOG10LTRIMMV_AVGMV_CONCATMV_COUNTMV_DEDUPEMV_MAXMV_MEDIANMV_MINMV_SUMNOWPIPOWRIGHTROUNDRTRIMSINSINHSPLITSQRTSTARTS_WITHSUBSTRINGTANTANHTAUTO_BOOLEANTO_DATETIMETO_DEGREESTO_DOUBLETO_INTEGERTO_IPTO_LONGTO_RADIANSTO_STRINGTO_UNSIGNED_LONGTO_VERSIONTRIM
- Aggregation functions
- Multivalued fields
- Metadata fields
- Task management
- SQL
- Overview
- Getting Started with SQL
- Conventions and Terminology
- Security
- SQL REST API
- SQL Translate API
- SQL CLI
- SQL JDBC
- SQL ODBC
- SQL Client Applications
- SQL Language
- Functions and Operators
- Comparison Operators
- Logical Operators
- Math Operators
- Cast Operators
- LIKE and RLIKE Operators
- Aggregate Functions
- Grouping Functions
- Date/Time and Interval Functions and Operators
- Full-Text Search Functions
- Mathematical Functions
- String Functions
- Type Conversion Functions
- Geo Functions
- Conditional Functions And Expressions
- System Functions
- Reserved keywords
- SQL Limitations
- Scripting
- Data management
- ILM: Manage the index lifecycle
- Tutorial: Customize built-in policies
- Tutorial: Automate rollover
- Index management in Kibana
- Overview
- Concepts
- Index lifecycle actions
- Configure a lifecycle policy
- Migrate index allocation filters to node roles
- Troubleshooting index lifecycle management errors
- Start and stop index lifecycle management
- Manage existing indices
- Skip rollover
- Restore a managed data stream or index
- Data tiers
- Autoscaling
- Monitor a cluster
- Roll up or transform your data
- Set up a cluster for high availability
- Snapshot and restore
- Secure the Elastic Stack
- Elasticsearch security principles
- Start the Elastic Stack with security enabled automatically
- Manually configure security
- Updating node security certificates
- User authentication
- Built-in users
- Service accounts
- Internal users
- Token-based authentication services
- User profiles
- Realms
- Realm chains
- Security domains
- Active Directory user authentication
- File-based user authentication
- LDAP user authentication
- Native user authentication
- OpenID Connect authentication
- PKI user authentication
- SAML authentication
- Kerberos authentication
- JWT authentication
- Integrating with other authentication systems
- Enabling anonymous access
- Looking up users without authentication
- Controlling the user cache
- Configuring SAML single-sign-on on the Elastic Stack
- Configuring single sign-on to the Elastic Stack using OpenID Connect
- User authorization
- Built-in roles
- Defining roles
- Role restriction
- Security privileges
- Document level security
- Field level security
- Granting privileges for data streams and aliases
- Mapping users and groups to roles
- Setting up field and document level security
- Submitting requests on behalf of other users
- Configuring authorization delegation
- Customizing roles and authorization
- Enable audit logging
- Restricting connections with IP filtering
- Securing clients and integrations
- Operator privileges
- Troubleshooting
- Some settings are not returned via the nodes settings API
- Authorization exceptions
- Users command fails due to extra arguments
- Users are frequently locked out of Active Directory
- Certificate verification fails for curl on Mac
- SSLHandshakeException causes connections to fail
- Common SSL/TLS exceptions
- Common Kerberos exceptions
- Common SAML issues
- Internal Server Error in Kibana
- Setup-passwords command fails due to connection failure
- Failures due to relocation of the configuration files
- Limitations
- Watcher
- Command line tools
- elasticsearch-certgen
- elasticsearch-certutil
- elasticsearch-create-enrollment-token
- elasticsearch-croneval
- elasticsearch-keystore
- elasticsearch-node
- elasticsearch-reconfigure-node
- elasticsearch-reset-password
- elasticsearch-saml-metadata
- elasticsearch-service-tokens
- elasticsearch-setup-passwords
- elasticsearch-shard
- elasticsearch-syskeygen
- elasticsearch-users
- How to
- Troubleshooting
- Fix common cluster issues
- Diagnose unassigned shards
- Add a missing tier to the system
- Allow Elasticsearch to allocate the data in the system
- Allow Elasticsearch to allocate the index
- Indices mix index allocation filters with data tiers node roles to move through data tiers
- Not enough nodes to allocate all shard replicas
- Total number of shards for an index on a single node exceeded
- Total number of shards per node has been reached
- Troubleshooting corruption
- Fix data nodes out of disk
- Fix master nodes out of disk
- Fix other role nodes out of disk
- Start index lifecycle management
- Start Snapshot Lifecycle Management
- Restore from snapshot
- Multiple deployments writing to the same snapshot repository
- Addressing repeated snapshot policy failures
- Troubleshooting an unstable cluster
- Troubleshooting discovery
- Troubleshooting monitoring
- Troubleshooting transforms
- Troubleshooting Watcher
- Troubleshooting searches
- Troubleshooting shards capacity health issues
- REST APIs
- API conventions
- Common options
- REST API compatibility
- Autoscaling APIs
- Behavioral Analytics APIs
- Compact and aligned text (CAT) APIs
- cat aliases
- cat allocation
- cat anomaly detectors
- cat component templates
- cat count
- cat data frame analytics
- cat datafeeds
- cat fielddata
- cat health
- cat indices
- cat master
- cat nodeattrs
- cat nodes
- cat pending tasks
- cat plugins
- cat recovery
- cat repositories
- cat segments
- cat shards
- cat snapshots
- cat task management
- cat templates
- cat thread pool
- cat trained model
- cat transforms
- Cluster APIs
- Cluster allocation explain
- Cluster get settings
- Cluster health
- Health
- Cluster reroute
- Cluster state
- Cluster stats
- Cluster update settings
- Nodes feature usage
- Nodes hot threads
- Nodes info
- Prevalidate node removal
- Nodes reload secure settings
- Nodes stats
- Cluster Info
- Pending cluster tasks
- Remote cluster info
- Task management
- Voting configuration exclusions
- Create or update desired nodes
- Get desired nodes
- Delete desired nodes
- Get desired balance
- Reset desired balance
- Cross-cluster replication APIs
- Data stream APIs
- Document APIs
- Enrich APIs
- EQL APIs
- Features APIs
- Fleet APIs
- Find structure API
- Graph explore API
- Index APIs
- Alias exists
- Aliases
- Analyze
- Analyze index disk usage
- Clear cache
- Clone index
- Close index
- Create index
- Create or update alias
- Create or update component template
- Create or update index template
- Create or update index template (legacy)
- Delete component template
- Delete dangling index
- Delete alias
- Delete index
- Delete index template
- Delete index template (legacy)
- Exists
- Field usage stats
- Flush
- Force merge
- Get alias
- Get component template
- Get field mapping
- Get index
- Get index settings
- Get index template
- Get index template (legacy)
- Get mapping
- Import dangling index
- Index recovery
- Index segments
- Index shard stores
- Index stats
- Index template exists (legacy)
- List dangling indices
- Open index
- Refresh
- Resolve index
- Rollover
- Shrink index
- Simulate index
- Simulate template
- Split index
- Unfreeze index
- Update index settings
- Update mapping
- Index lifecycle management APIs
- Create or update lifecycle policy
- Get policy
- Delete policy
- Move to step
- Remove policy
- Retry policy
- Get index lifecycle management status
- Explain lifecycle
- Start index lifecycle management
- Stop index lifecycle management
- Migrate indices, ILM policies, and legacy, composable and component templates to data tiers routing
- Ingest APIs
- Info API
- Licensing APIs
- Logstash APIs
- Machine learning APIs
- Machine learning anomaly detection APIs
- Add events to calendar
- Add jobs to calendar
- Close jobs
- Create jobs
- Create calendars
- Create datafeeds
- Create filters
- Delete calendars
- Delete datafeeds
- Delete events from calendar
- Delete filters
- Delete forecasts
- Delete jobs
- Delete jobs from calendar
- Delete model snapshots
- Delete expired data
- Estimate model memory
- Flush jobs
- Forecast jobs
- Get buckets
- Get calendars
- Get categories
- Get datafeeds
- Get datafeed statistics
- Get influencers
- Get jobs
- Get job statistics
- Get model snapshots
- Get model snapshot upgrade statistics
- Get overall buckets
- Get scheduled events
- Get filters
- Get records
- Open jobs
- Post data to jobs
- Preview datafeeds
- Reset jobs
- Revert model snapshots
- Start datafeeds
- Stop datafeeds
- Update datafeeds
- Update filters
- Update jobs
- Update model snapshots
- Upgrade model snapshots
- Machine learning data frame analytics APIs
- Create data frame analytics jobs
- Delete data frame analytics jobs
- Evaluate data frame analytics
- Explain data frame analytics
- Get data frame analytics jobs
- Get data frame analytics jobs stats
- Preview data frame analytics
- Start data frame analytics jobs
- Stop data frame analytics jobs
- Update data frame analytics jobs
- Machine learning trained model APIs
- Clear trained model deployment cache
- Create or update trained model aliases
- Create part of a trained model
- Create trained models
- Create trained model vocabulary
- Delete trained model aliases
- Delete trained models
- Get trained models
- Get trained models stats
- Infer trained model
- Start trained model deployment
- Stop trained model deployment
- Update trained model deployment
- Migration APIs
- Node lifecycle APIs
- Query rules APIs
- Reload search analyzers API
- Repositories metering APIs
- Rollup APIs
- Script APIs
- Search APIs
- Search Application APIs
- Searchable snapshots APIs
- Security APIs
- Authenticate
- Change passwords
- Clear cache
- Clear roles cache
- Clear privileges cache
- Clear API key cache
- Clear service account token caches
- Create API keys
- Create or update application privileges
- Create or update role mappings
- Create or update roles
- Create or update users
- Create service account tokens
- Delegate PKI authentication
- Delete application privileges
- Delete role mappings
- Delete roles
- Delete service account token
- Delete users
- Disable users
- Enable users
- Enroll Kibana
- Enroll node
- Get API key information
- Get application privileges
- Get builtin privileges
- Get role mappings
- Get roles
- Get service accounts
- Get service account credentials
- Get token
- Get user privileges
- Get users
- Grant API keys
- Has privileges
- Invalidate API key
- Invalidate token
- OpenID Connect prepare authentication
- OpenID Connect authenticate
- OpenID Connect logout
- Query API key information
- Update API key
- Bulk update API keys
- SAML prepare authentication
- SAML authenticate
- SAML logout
- SAML invalidate
- SAML complete logout
- SAML service provider metadata
- SSL certificate
- Activate user profile
- Disable user profile
- Enable user profile
- Get user profiles
- Suggest user profile
- Update user profile data
- Has privileges user profile
- Create Cross-Cluster API key
- Update Cross-Cluster API key
- Snapshot and restore APIs
- Snapshot lifecycle management APIs
- SQL APIs
- Synonyms APIs
- Transform APIs
- Usage API
- Watcher APIs
- Definitions
- Migration guide
- Release notes
- Elasticsearch version 8.11.0
- Elasticsearch version 8.10.0
- Elasticsearch version 8.9.2
- Elasticsearch version 8.9.1
- Elasticsearch version 8.9.0
- Elasticsearch version 8.8.2
- Elasticsearch version 8.8.1
- Elasticsearch version 8.8.0
- Elasticsearch version 8.7.1
- Elasticsearch version 8.7.0
- Elasticsearch version 8.6.2
- Elasticsearch version 8.6.1
- Elasticsearch version 8.6.0
- Elasticsearch version 8.5.3
- Elasticsearch version 8.5.2
- Elasticsearch version 8.5.1
- Elasticsearch version 8.5.0
- Elasticsearch version 8.4.3
- Elasticsearch version 8.4.2
- Elasticsearch version 8.4.1
- Elasticsearch version 8.4.0
- Elasticsearch version 8.3.3
- Elasticsearch version 8.3.2
- Elasticsearch version 8.3.1
- Elasticsearch version 8.3.0
- Elasticsearch version 8.2.3
- Elasticsearch version 8.2.2
- Elasticsearch version 8.2.1
- Elasticsearch version 8.2.0
- Elasticsearch version 8.1.3
- Elasticsearch version 8.1.2
- Elasticsearch version 8.1.1
- Elasticsearch version 8.1.0
- Elasticsearch version 8.0.1
- Elasticsearch version 8.0.0
- Elasticsearch version 8.0.0-rc2
- Elasticsearch version 8.0.0-rc1
- Elasticsearch version 8.0.0-beta1
- Elasticsearch version 8.0.0-alpha2
- Elasticsearch version 8.0.0-alpha1
- Dependencies and versions
PERCENTILEedit
The value at which a certain percentage of observed values occur. For example,
the 95th percentile is the value which is greater than 95% of the observed values and
the 50th percentile is the MEDIAN.
FROM employees
| STATS p0 = PERCENTILE(salary,  0)
     , p50 = PERCENTILE(salary, 50)
     , p99 = PERCENTILE(salary, 99)
| p0:double | p50:double | p99:double |
|---|---|---|
25324 |
47003 |
74970.29 |
PERCENTILE is (usually) approximateedit
There are many different algorithms to calculate percentiles. The naive
implementation simply stores all the values in a sorted array. To find the 50th
percentile, you simply find the value that is at my_array[count(my_array) * 0.5].
Clearly, the naive implementation does not scale — the sorted array grows linearly with the number of values in your dataset. To calculate percentiles across potentially billions of values in an Elasticsearch cluster, approximate percentiles are calculated.
The algorithm used by the percentile metric is called TDigest (introduced by
Ted Dunning in
Computing Accurate Quantiles using T-Digests).
When using this metric, there are a few guidelines to keep in mind:
-
Accuracy is proportional to
q(1-q). This means that extreme percentiles (e.g. 99%) are more accurate than less extreme percentiles, such as the median - For small sets of values, percentiles are highly accurate (and potentially 100% accurate if the data is small enough).
- As the quantity of values in a bucket grows, the algorithm begins to approximate the percentiles. It is effectively trading accuracy for memory savings. The exact level of inaccuracy is difficult to generalize, since it depends on your data distribution and volume of data being aggregated
The following chart shows the relative error on a uniform distribution depending on the number of collected values and the requested percentile:
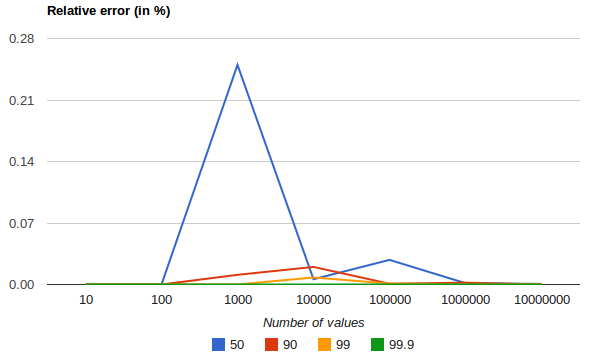
It shows how precision is better for extreme percentiles. The reason why error diminishes for large number of values is that the law of large numbers makes the distribution of values more and more uniform and the t-digest tree can do a better job at summarizing it. It would not be the case on more skewed distributions.
PERCENTILE is also non-deterministic.
This means you can get slightly different results using the same data.
On this page