Dashboard and visualizationsedit
Visualize your data with dashboards.
The best way to understand your data is to visualize it. With dashboards, you can turn your data from one or more data views into a collection of panels that bring clarity to your data, tell a story about your data, and allow you to focus on only the data that’s important to you.
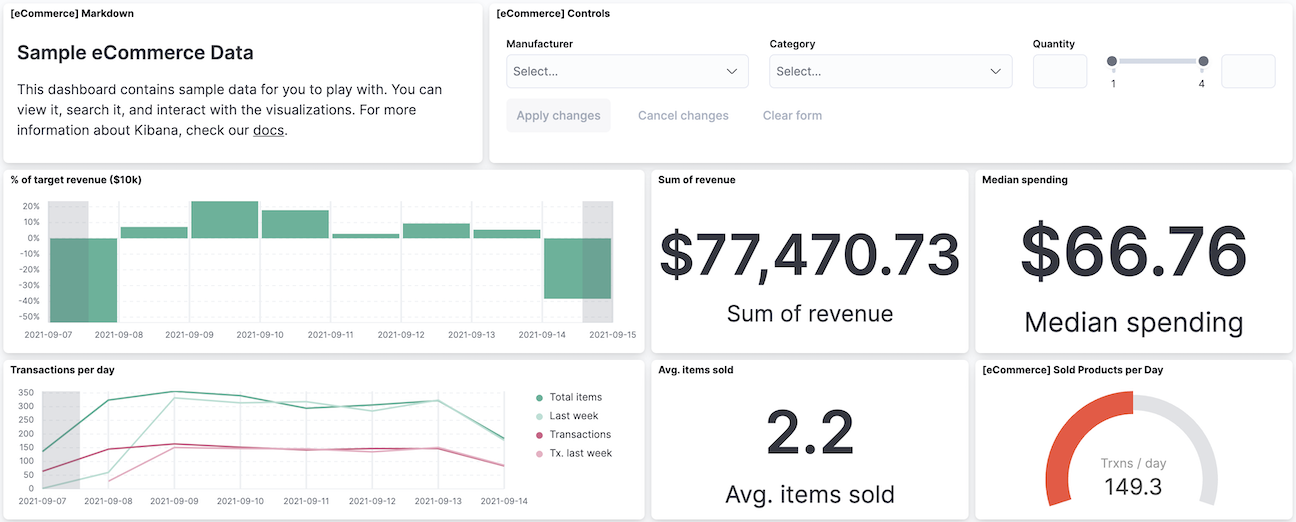
Panels display your data in charts, tables, maps, and more, which allow you to compare your data side-by-side to identify patterns and connections. Dashboards support several types of panels to display your data, and several options to create panels.
Use one of the editors to create visualizations of your data. Each editor varies in capabilities for all levels of analysts. |
|
Create beautiful displays of your geographical data. |
|
Display the results from machine learning anomaly detection jobs. |
|
Display an anomaly chart from the Anomaly Explorer. |
|
Display a table of live streaming logs. |
|
Add interactive filters with Controls panels. |
|
Add context to your panels with Text. |
|
Personalize your dashboard with a custom image. |
Create dashboardsedit
Dashboards provide you with the space where you add panels of your data.
Minimum requirementsedit
To create dashboards, you must meet the minimum requirements.
- If you need to set up Kibana, use our free trial.
- Make sure you have data indexed into Elasticsearch and a data view.
- When the read-only indicator appears, you have insufficient privileges to create or save dashboards, and the options to create and save dashboards are not visible. For more information, refer to Granting access to Kibana.
Open the dashboardedit
Begin with an empty dashboard, or open an existing dashboard.
- Open the main menu, then click Dashboard.
-
On the Dashboards page, choose one of the following options:
-
To start with an empty dashboard, click Create dashboard.
When you create a dashboard, you are automatically in edit mode and can make changes to the dashboard.
-
To open an existing dashboard, click the dashboard Title you want to open.
When you open an existing dashboard, you are in view mode. To make changes to the dashboard, click Edit in the toolbar.
-
Create and add panelsedit
You create panels using the editors, which you can access from the dashboard toolbar or the Visualize Library, or add panels that are saved in the Visualize Library, or search results from Discover.
To create panels from the dashboard toolbar, use one of the following options:
- Create visualization — Opens the drag-and-drop editor, which is the recommended way to create visualization panels.
- Select type — Opens the menu for all of the editors and panel types.
To create panels from the Visualize Library:
- Open the main menu, then click Visualize Library.
- Click Create visualization, then select an editor.
To add existing panels from the Visualize Library:
- In the dashboard toolbar, click Add from library.
-
Click the panel you want to add to the dashboard, then click X.
When a panel contains a saved query, both queries are applied.
When you add search results from Discover to dashboards, the results are not aggregated.
Save and add panelsedit
Consider where you want to save and add the panel in Kibana.
Save to the Visualize Libraryedit
To use the panel on other dashboards and Canvas workpads, save the panel to the Visualize Library. When panels are saved in the Visualize Library, ![]() appears in the panel header.
appears in the panel header.
If you created the panel from the dashboard:
- In the editor, click Save to library.
- Enter the Title and add any applicable Tags.
- Make sure that Add to Dashboard after saving is selected.
- Click Save and return.
If you created the panel from the Visualize Library:
- In the editor, click Save.
- On the Save window, enter the Title.
-
Choose one of the following options:
Save to the dashboardedit
Return to the dashboard and add the panel without specifying the save options or adding the panel to the Visualize Library.
If you created the panel from the dashboard:
- In the editor, click Save and return.
-
Add an optional title to the panel.
- In the panel header, click No Title.
- On the Panel settings window, select Show title.
- Enter the Title, then click Save.
If you created the panel from the Visualize Library:
- Click Save.
- On the Save window, enter the Title.
-
Choose one of the following options:
- If you want to add the panel to an existing dashboard, select Existing, select the dashboard from the dropdown, then click Save and go to Dashboard.
- If you want to add the panel to a new dashboard, select New, then click Save and go to Dashboard.
To add unsaved dashboard panels to the Visualize Library:
- Open the panel menu, then select More > Save to library.
- Enter the panel title, then click Save.
Add context to panelsedit
To provide context to your dashboard panels, add Text panels that display important information, instructions, images, and more. You create Text panels using GitHub-flavored Markdown text.
-
On the dashboard, click
 .
.
- In the Markdown field, enter the text, then click Update.
For example, when you enter:
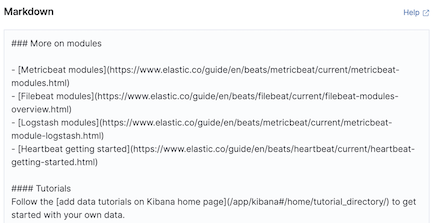
The following instructions are displayed:
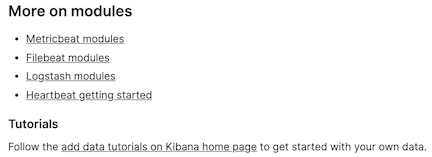
Or when you enter:

The following image is displayed:
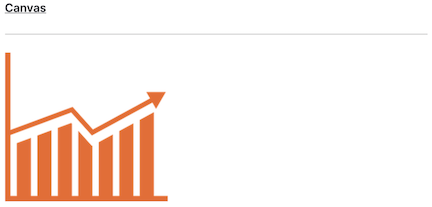
For detailed information about writing on GitHub, click Help.
Save and add the paneledit
Save the panel to the Visualize Library and add it to the dashboard, or add it to the dashboard without saving.
To save the panel to the Visualize Library:
- Click Save to library.
- Enter the Title and add any applicable Tags.
- Make sure that Add to Dashboard after saving is selected.
- Click Save and return.
To save the panel to the dashboard:
- Click Save and return.
-
Add an optional title to the panel.
- In the panel header, click No Title.
- On the Panel settings window, select Show title.
- Enter the Title, then click Save.
Add image panelsedit
To personalize your dashboards, add your own logos and graphics with the Image panel. You can upload images from your computer, select previously uploaded images, or add images from an external link.
-
On the dashboard, click
 .
.
- Use the editor to add an image.
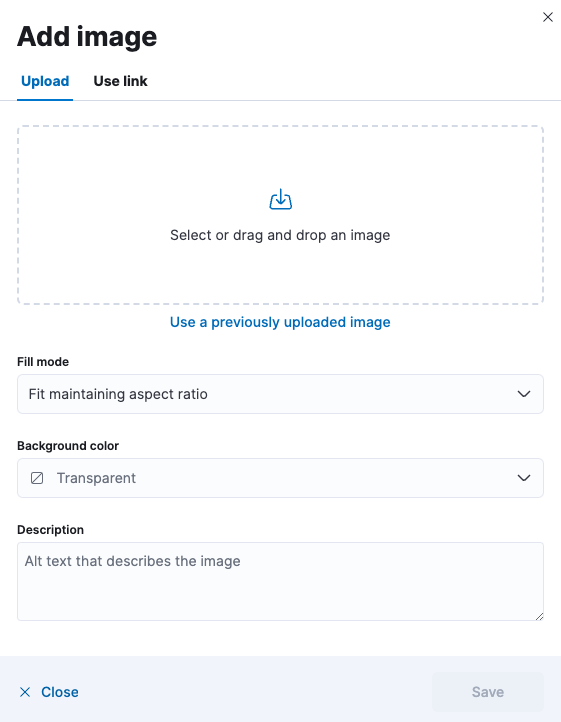
To manage your uploaded image files, open the main menu, then click Stack Management > Kibana > Files.
When you export a dashboard, the uploaded image files are not exported.
When importing a dashboard with an image panel, and the image file is unavailable, the image panel displays a not found warning. Such panels have to be fixed manually by re-uploading the image using the panel’s image editor.
Arrange panelsedit
Compare the data in your panels side-by-side, organize panels by priority, resize the panels so they all appear immediately on the dashboard, and more.
In the toolbar, click Edit, then use the following options:
- To move, click and hold the panel header, then drag to the new location.
- To resize, click the resize control, then drag to the new dimensions.
- To maximize to fullscreen, open the panel menu, then click More > Maximize panel.
Edit panelsedit
To make changes to the panel, use the panel menu options.
- In the toolbar, click Edit.
-
Open the panel menu, then use the following options:
- Edit lens — Opens Lens so you can make changes to the visualization.
-
Edit visualization — Opens the editor so you can make changes to the panel.
To make changes without changing the original version, open the panel menu, then click More > Unlink from library.
- Convert to Lens — Opens TSVB and aggregation-based visualizations in Lens.
- Panel settings — Opens the Panel settings window to change the title, description, and time range.
- More > Replace panel — Opens the Visualize Library so you can select a new panel to replace the existing panel.
-
More > Delete from dashboard — Removes the panel from the dashboard.
If you want to use the panel later, make sure that you save the panel to the Visualize Library.
Duplicate panelsedit
To duplicate a panel and the configured functionality, use the clone and copy panel options. Cloned and copied panels replicate all of the functionality from the original panel, including renaming, editing, and cloning.
Clone panelsedit
Cloned panels appear next to the original panel, and move the other panels to provide a space on the dashboard.
- In the toolbar, click Edit.
-
Open the panel menu, then select Clone panel.
When cloned panels are saved in the Visualize Library,
 appears in the header.
Copy panelsedit
Copy panels from one dashboard to another dashboard.
- Open the panel menu, then select More > Copy to dashboard.
- On the Copy to dashboard window, select the dashboard, then click Copy and go to dashboard.
Add the dashboard settingsedit
Add the title, tags, design options, and more to the dashboard.
- In the toolbar, click Settings.
- On the Dashboard settings flyout, enter the Title and an optional Description.
- Add any applicable Tags.
-
Specify the following settings:
- Store time with dashboard — Saves the specified time filter.
- Use margins between panels — Adds a margin of space between each panel.
- Show panel titles — Displays the titles in the panel headers.
- Sync color palettes across panels — Applies the same color palette to all panels on the dashboard.
- Sync cursor across panels — When you hover your cursor over a Lens, TSVB, aggregation-based, or Timelion XY or heatmap chart, the cursor on all other related dashboard charts automatically appears.
- Sync tooltips across panels — When you hover your cursor over a Lens, TSVB, aggregation-based, or Timelion XY chart, the tooltips on all other related dashboard charts automatically appears.
- Click Apply.
Reset the dashboardedit
To remove any dashboard changes you’ve made, reset the dashboard to the last saved changes.
- In the toolbar, click Reset.
- On the Reset dashboard window, click Reset dashboard.
Save dashboardsedit
When you’ve finished making changes to the dashboard, save it.
- In the toolbar, click Save.
- To exit Edit mode, click Switch to view mode.
Search and filter your dataedit
Kibana supports several ways to search your data and apply Elasticsearch filters. You can combine the filters with any panel filter to display the data want to you see.
For more information about Kibana and Elasticsearch filters, refer to Kibana concepts.
To apply a panel-level time filter:
- Open the panel menu, then select More > Panel settings.
- Select Apply a custom time range.
- Enter the time range you want to view, then click Save.
To view and edit panel-level filters:
-
On the panel, click
 .
.
- To edit, click Edit filters.
View the panel data and requestsedit
View the data in visualizations and the requests that collect the data.
- Open the panel menu, then click More > Inspect.
-
View and download the panel data.
- Open the View dropdown, then click Data.
-
Click Download CSV, then select the format type from the dropdown:
- Formatted CSV — Contains human-readable dates and numbers.
-
Unformatted — Best used for computer use.
When you download visualization panels with multiple layers, each layer produces a CSV file, and the file names contain the visualization and layer data view names.
-
View the requests that collect the data.
- Open the View dropdown, then click Requests.
- From the dropdown, select the requests you want to view.
- To view the requests in Console, click Request, then click Open in Console.
Share dashboardsedit
To share the dashboard with a larger audience, click Share in the toolbar. For detailed information about the sharing options, refer to Reporting.
Export dashboardsedit
To automate Kibana, you can export dashboards as NDJSON using the Export objects API. It is important to export dashboards with all necessary references.