Function argumentsedit
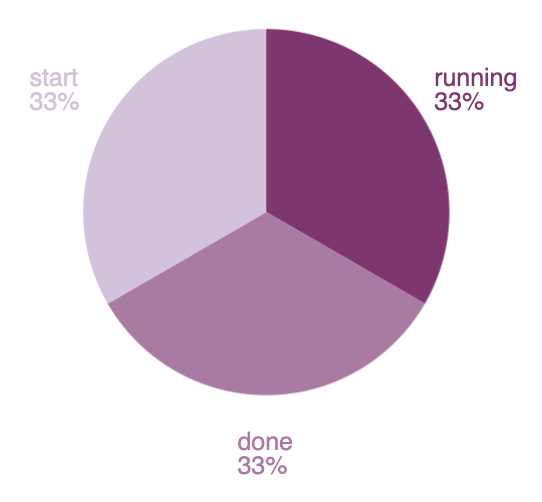
Let’s look at another expression, which uses the same demodata function, but instead produces a pie chart.

filters
| demodata
| pointseries color="state" size="max(price)"
| pie
| render
To produce a filtered set of random data, the expression uses the filters and demodata functions. This time, however, the output becomes the context for the pointseries function, which is a way to aggregate your data, similar to how Elasticsearch works, but more generalized. In this case, the data is split up using the color and size dimensions, using arguments on the pointseries function. Each unique value in the state column will have an associated size value, which in this case, will be the maximum value of the price column.
If the expression stopped there, it would produce a pointseries data type as the output of this expression. But instead of looking at the raw values, the result is inserted into the pie function, which will produce an output that will render a pie visualization. And just like before, this is inserted into the render function, which is useful for its arguments.
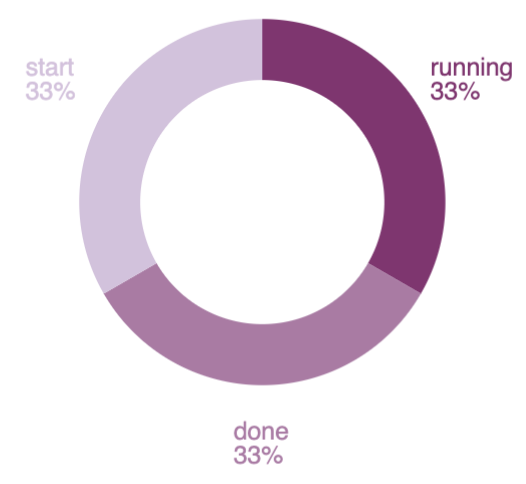
The end result is a simple pie chart that uses the default color palette, but the pie function can take additional arguments that control how it gets rendered. For example, you can provide a hole argument to turn your pie chart into a donut chart by changing the expression to:

filters
| demodata
| pointseries color="state" size="max(price)"
| pie hole=50
| render