Access Kibanaedit
The fastest way to access Kibana is to use our hosted Elasticsearch Service. If you installed Kibana on your own, access Kibana through the web application.
In the case of installing Kibana on our own, we need to modify Kibana config so that we can visit Kibana UI from our another machine
sudo nano /etc/kibana/kibana.yml
Find the line starting with #server.host and change that line to
server.host: "0.0.0.0"
Then we could visit the Kibana-hosting machine anywhere from http://server-ip:5601
Set up on cloudedit
There’s no faster way to get started than with our hosted Elasticsearch Service on Elastic Cloud:
- Get a free trial.
- Log into Elastic Cloud.
- Click Create deployment.
- Give your deployment a name.
-
Click Create deployment and download the password for the
elasticuser.
That’s it! Now that you are up and running, it’s time to get some data into Kibana. Kibana will open as soon as your deployment is ready.
Log on to the web applicationedit
If you are using a self-managed deployment, access Kibana through the web application on port 5601.
-
Point your web browser to the machine where you are running Kibana and specify the port number. For example,
localhost:5601orhttp://YOURDOMAIN.com:5601.To remotely connect to Kibana, set server.host to a non-loopback address.
- Log on to your account.
- Go to the home page, then click Kibana.
- To make the Kibana page your landing page, click Make this my landing page.
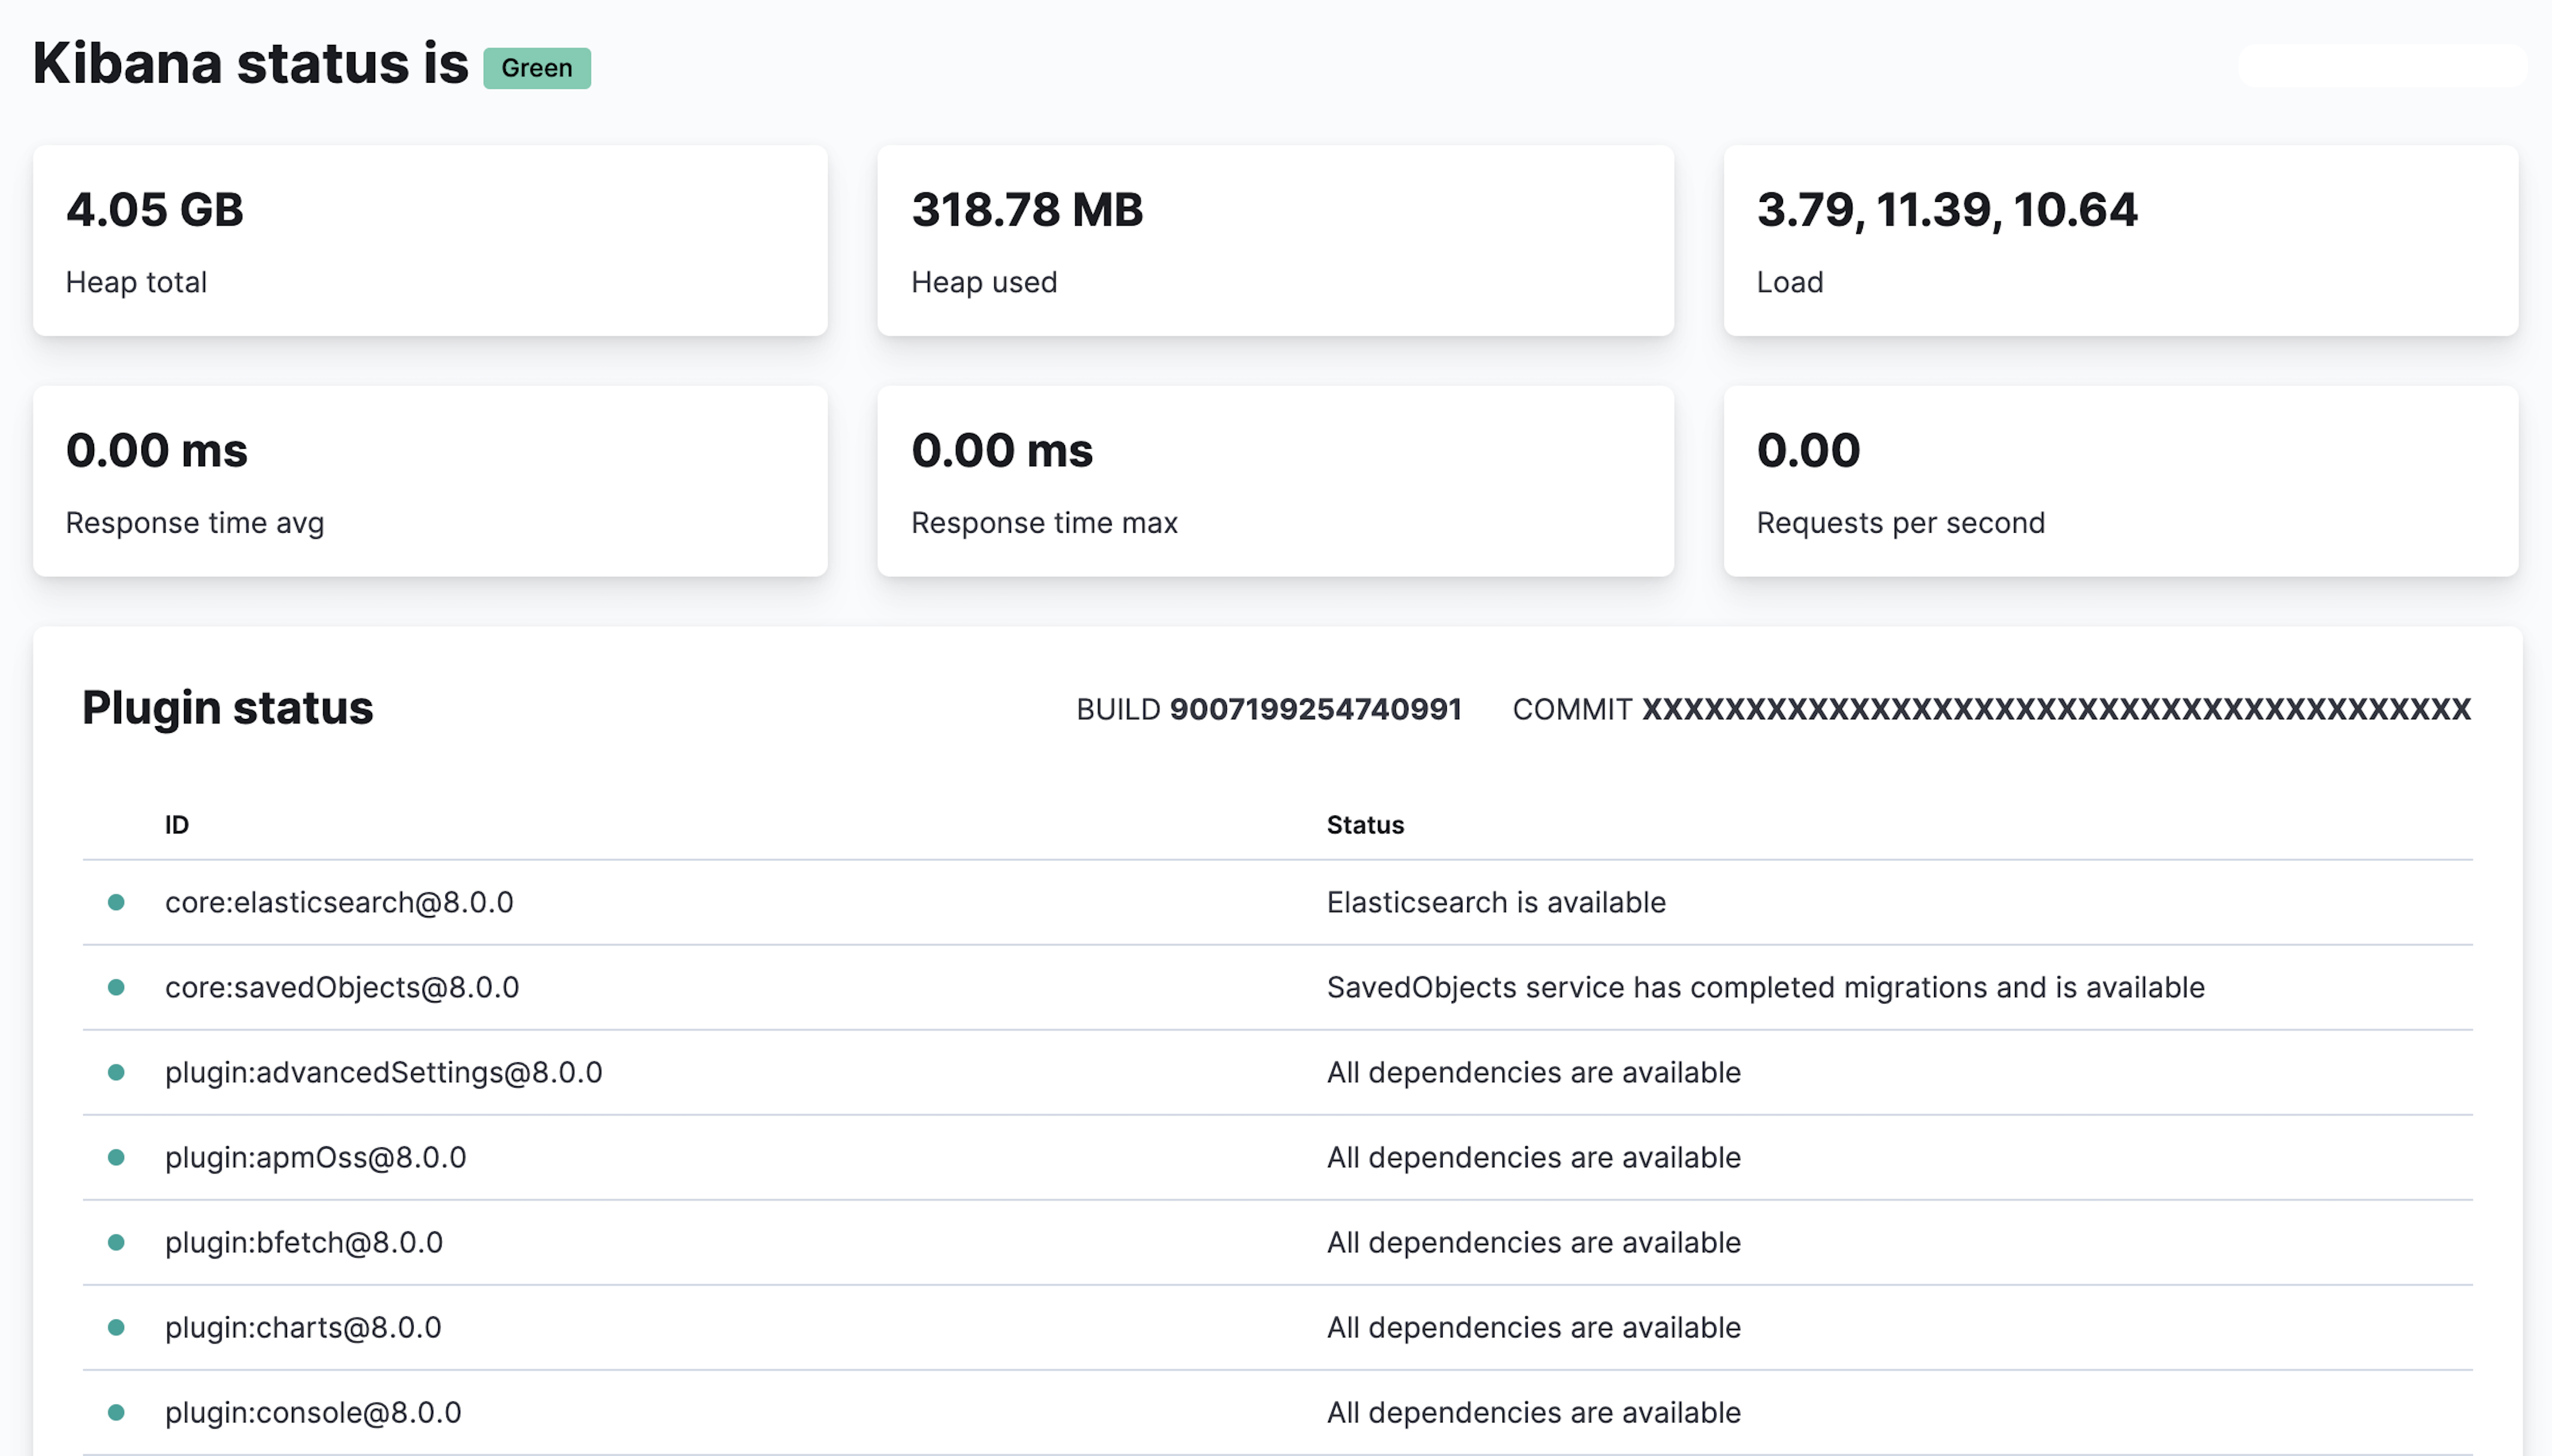
Check the Kibana statusedit
The status page displays information about the server resource usage and installed plugins.
To view the Kibana status page, use the status endpoint. For example, localhost:5601/status.

For JSON-formatted server status details, use the localhost:5601/api/status API endpoint.
Troubleshoot Kibana UI erroredit
Troubleshoot the Kibana Server is not Ready yet error.
-
From within a Kibana node, confirm the connection to Elasticsearch:
curl -XGET elasticsearch_ip_or_hostname:9200/
-
Guarantee the health of the three Kibana-backing indices. All indices must appear and display
status:greenandstatus:open:curl -XGET elasticsearch_ip_or_hostname:9200/_cat/indices/.kibana,.kibana_task_manager,.kibana_security_session?v=true
- Shut down all Kibana nodes.
- Choose any Kibana node, then update the config to set the debug logging.
-
Start the node, then check the start-up debug logs for
ERRORmessages or other start-up issues.For example:
-
When Kibana is unable to connect to a healthy Elasticsearch cluster, errors like
master_not_discovered_exceptionorunable to revive connectionorlicense is not availableerrors appear. -
When one or more Kibana-backing indices are unhealthy, the
index_not_green_timeouterror appears.
-
When Kibana is unable to connect to a healthy Elasticsearch cluster, errors like